
Executive Summary
- Companies have optimised their supply chains for decades to benefit from the world’s lowest cost and most scalable manufacturing destination.
- This is changing on the back of higher costs, heightened strategic rivalry between China and other countries as well as rising ESG considerations. Supply chain security and diversification are now at the forefront of most companies’ medium-term investment plans.
- A structural recalibrating of global supply chains away from China is underway, presenting a once-in-a generation opportunity for emerging market countries that have the necessary resources and readiness. We believe that this backdrop presents a structural opportunity that disciplined bottom-up investors can seize.
For decades, companies have optimised their supply chains to benefit from the world’s lowest cost and most scalable manufacturing destination. China’s abundance of low wage workers, strong ecosystem of suppliers, component manufacturers and distributors have made it an efficient and cost-effective location to manufacture products, helping it to become the “factory of the world”.
However, a confluence of factors over the last decade has prompted countries to shift their supply chains away from China, either by reshoring (bringing production back to their home countries), nearshoring (moving production closer to their home countries), or friendshoring (moving production to friendly or allied countries), a process we have termed as the “Great Transition” in this article.
Some of the factors driving the Great Transition include:
China’s dominance in strategic industries
China’s dominance in strategic industries such as mobile communications, electric battery technology and telecom hardware has risen over the last 5 years. Fig. 1. Meanwhile, the COVID-19 pandemic, heightened strategic rivalry between China and other countries including the US, India, Japan and Australia, as well as the recent developments in Ukraine have intensified the desire for countries to enhance their supply chain resilience and security.
Fig. 1. China’s share in strategic industries
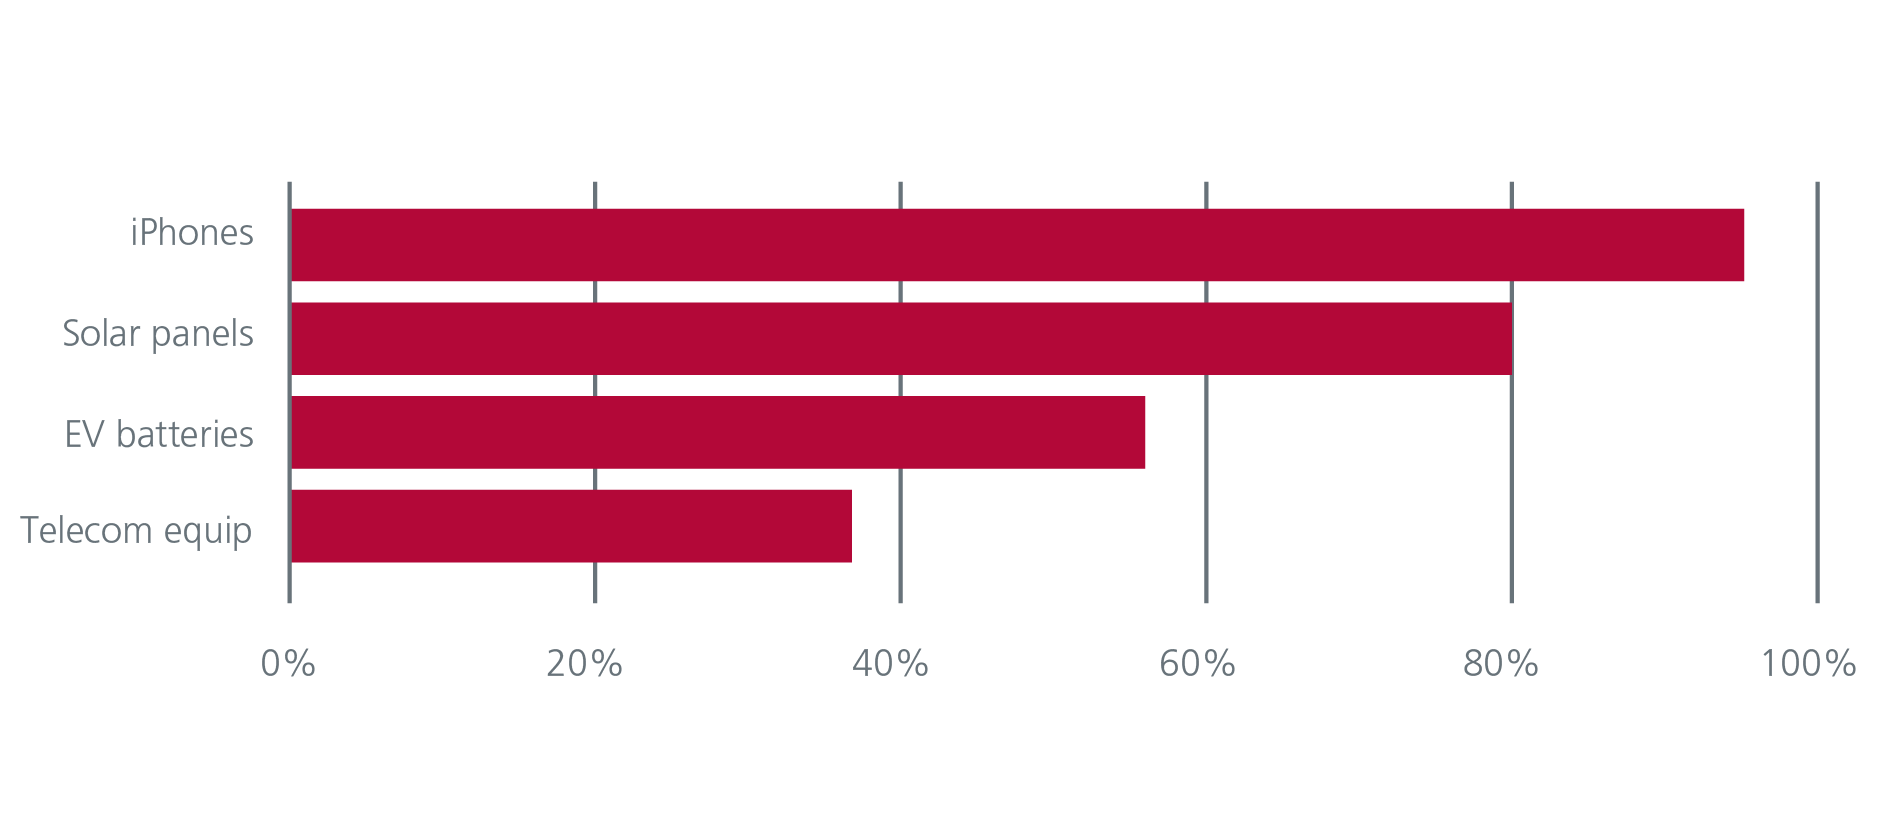
Source: Eastspring, Visual Capitalist, Dell’Oro Group. March 2023.
In February 2021, President Biden initiated a review of American supply chains with the intention to reduce reliance on foreign suppliers, especially for critical products such as semiconductors, pharmaceuticals, rare earth elements, and batteries. The review also sought to identify potential vulnerabilities and opportunities for cooperation with allies. The US has since put in place various policies to foster onshoring and friendshoring. These include the Bipartisan Infrastructure Law (2021) which requires federal agencies to use domestic materials and products for infrastructure projects, and the CHIPS and Science Act (2022) which includes incentives and grants for domestic chip manufacturing and supply chain security. At the same time, the Inflation Reduction Act (2022) reduces the corporate tax rate for companies that produce goods and services in the US and hire Americans.
The US and EU also established the US-EU Trade and Technology Council (TTC) in June 2021 which is viewed as a vehicle for advancing the friendshoring agenda, by harmonising regulatory standards and promoting innovation and competitiveness.
Rising importance of ESG
The increasing prioritisation of Environmental, Social and Governance (ESG) issues for countries, companies and regulators globally has also prompted companies to diversify their supply chains. As the world’s largest emitter of greenhouse gases, China faces growing scrutiny for its heavy dependence on coal as an energy source. Fig. 2. Going forward, more stringent environmental regulations would potentially push operating and investment costs higher for businesses that have their manufacturing hubs in China.
Fig. 2. Share of global greenhouse gas emissions by country (2022)
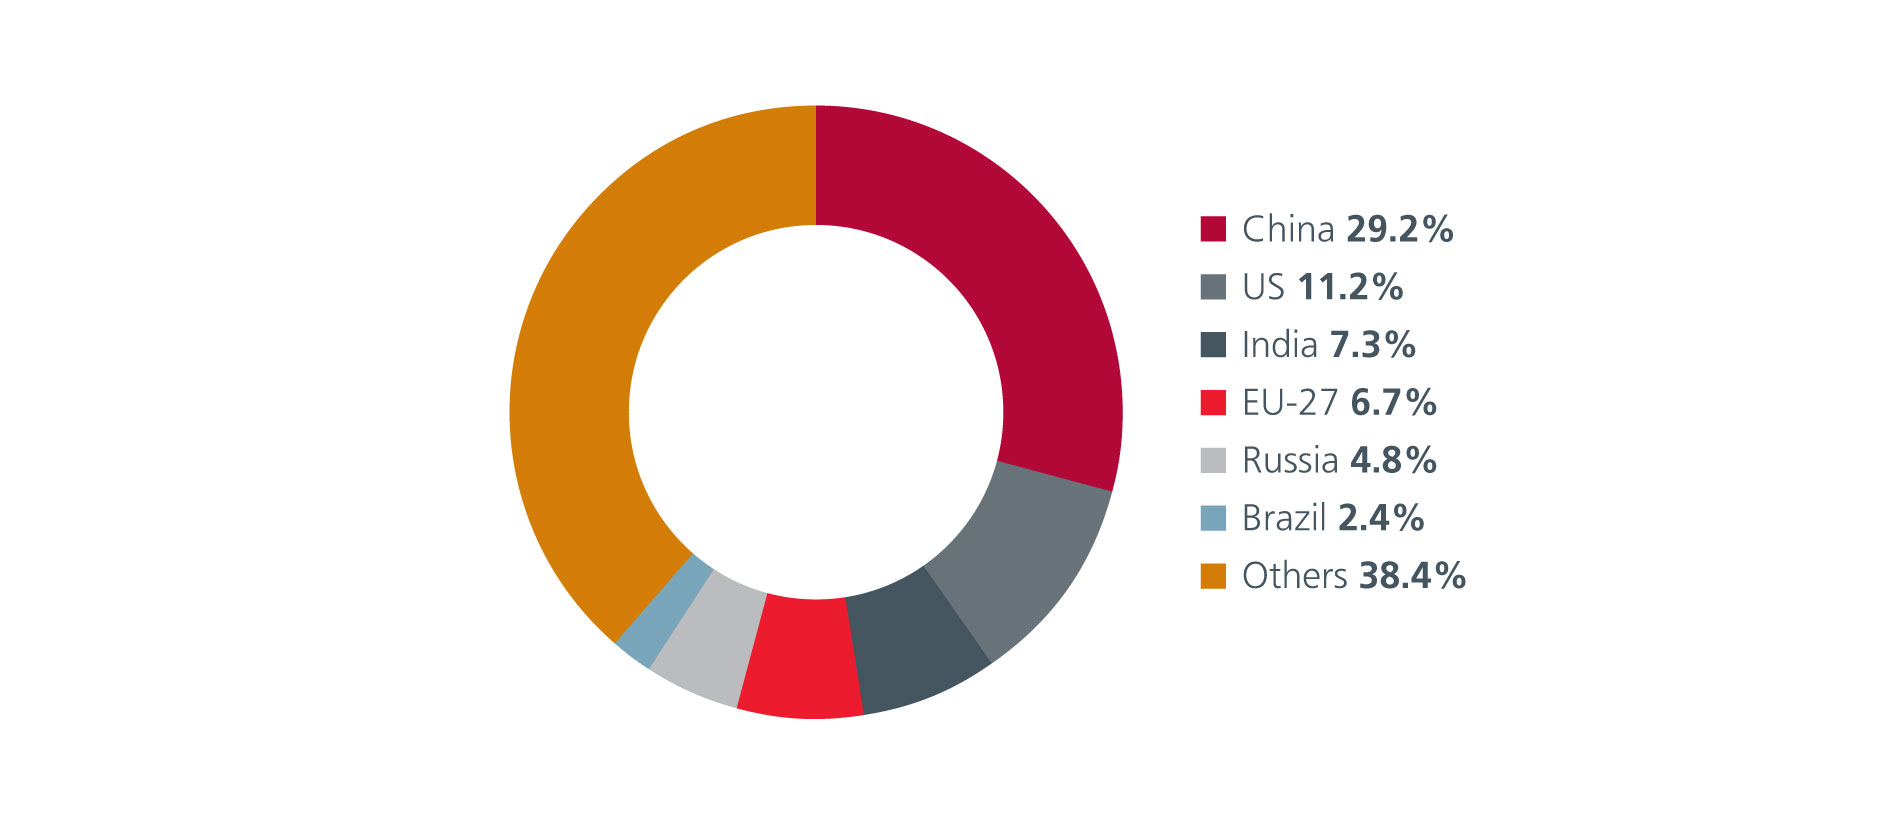
Source: Statista.
Eroding cost advantages
China’s labour cost advantage over the US has eroded over the years, in line with China’s economic growth and ageing population. When China entered the World Trade Organisation in 2001, the gap between the annual wage of the average American worker versus his Chinese counterpart was 30x. This wage gap has since fallen to 3.5x as of 20211. Meanwhile, the manufacturing wages of China are more than twice of Brazil and Mexico2 and potentially greater than India and selected countries in ASEAN. Fig. 3.
Fig. 3. Manufacturing wages (USD/hour)
Source: Euromonitor, Morgan Stanley Research. Oct 2022.
Is the Great Transition really happening?
The global supply chain transition has impacted corporate sentiment, trade and investments.
A recent survey of US and European companies showed that more than 50% of US and European respondents has near or re-shored operations in the last 12 months3. In another survey, companies cited China’s COVID policy, the desire for greater supply chain resilience and increased costs as the top three reasons for diversifying their supply chains away from China4.
Meanwhile, there is evidence that companies have started to move some of their manufacturing facilities to ASEAN and India. Since the start of the US-China trade war, the value of US imports has contracted for China but expanded for ASEAN and India, as well as the other major exporting countries. Fig. 4. The US’ and EU’s restrictions on the exports of advanced semiconductor chips and production equipment to China are likely to have hurt the exports from China’s high-end electronics and automobile manufacturing industries.
Fig. 4. % Change in value of US imports by source country (2018 – 2021)
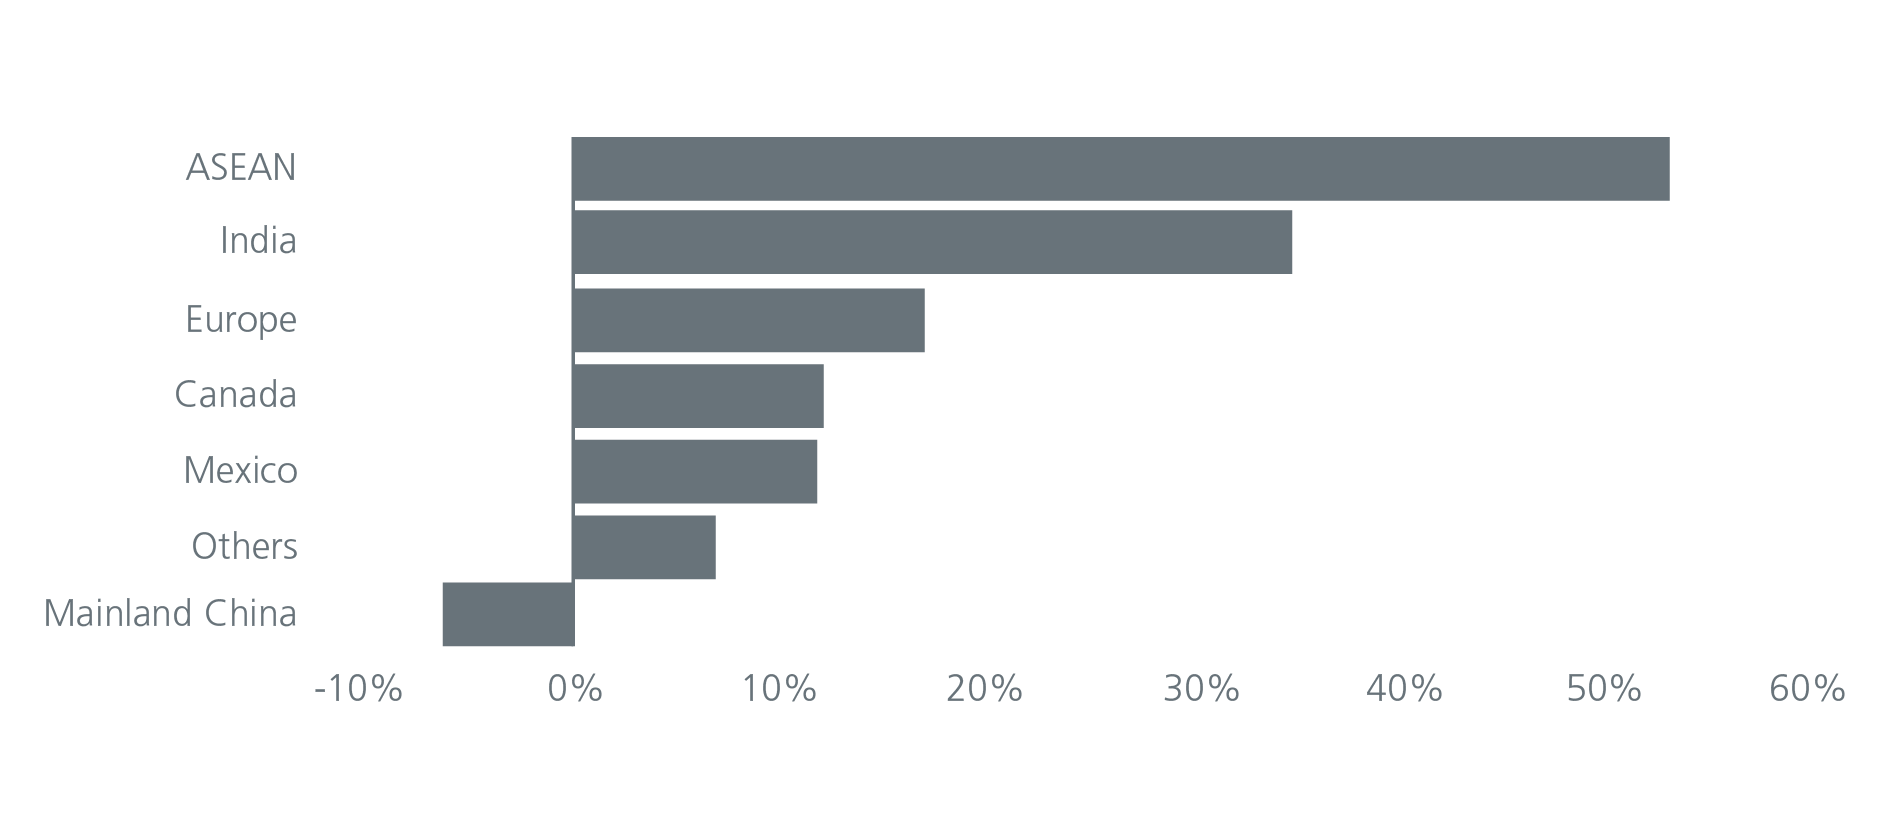
Source: US Census Bureau, HSBC. Oct 2022.
Inward Foreign Direct Investments (FDI) into China has also been declining sharply since the second quarter of 2022, turning the direct investment balance under the Balance of Payments (BoP) into a deficit for some time. More recently, China's inbound FDI flows fell into negative territory in the third quarter of 2023 for the first time since the series began. Fig. 5. As the BoP measure captures the repatriation of working capital as well as earnings of the MNCs in China, the lower interest rates in China as well as weaker industrial profits also have a part to play in the lower FDI readings. That said, geopolitical tensions as well as weak business confidence have clearly reduced China’s appeal as an investment destination.
Fig. 5. China’s inbound vs outbound FDI (BoP data)
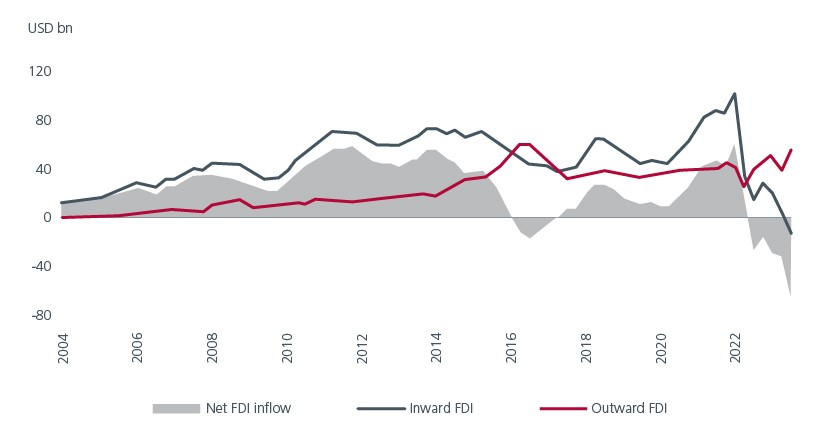
Source: BofA Global Research, CEIC. December 2023. Data prior to 2022 are shown as 4qtr moving average.
Who benefits from the Great Transition?
China will still be a dominant and influential player in global supply chains given its large and skilled workforce, excellent infrastructure, and huge domestic market. The shift away from China is therefore likely to be gradual and partial. That said, the transition will still yield outsized opportunities for many economies and companies across the Global Emerging Markets. The largest beneficiaries of this transition are likely to be in ASEAN, Latin America, India and EMEA, countries with cheap labour, decent manufacturing bases and producers of key commodities. The combined manufacturing value add of these countries is less than half that of China. See Fig. 6. As such, a small shift away from China adds a significant amount of manufacturing value add to these countries.
Fig. 6. 2021 manufacturing value add (USD bn)
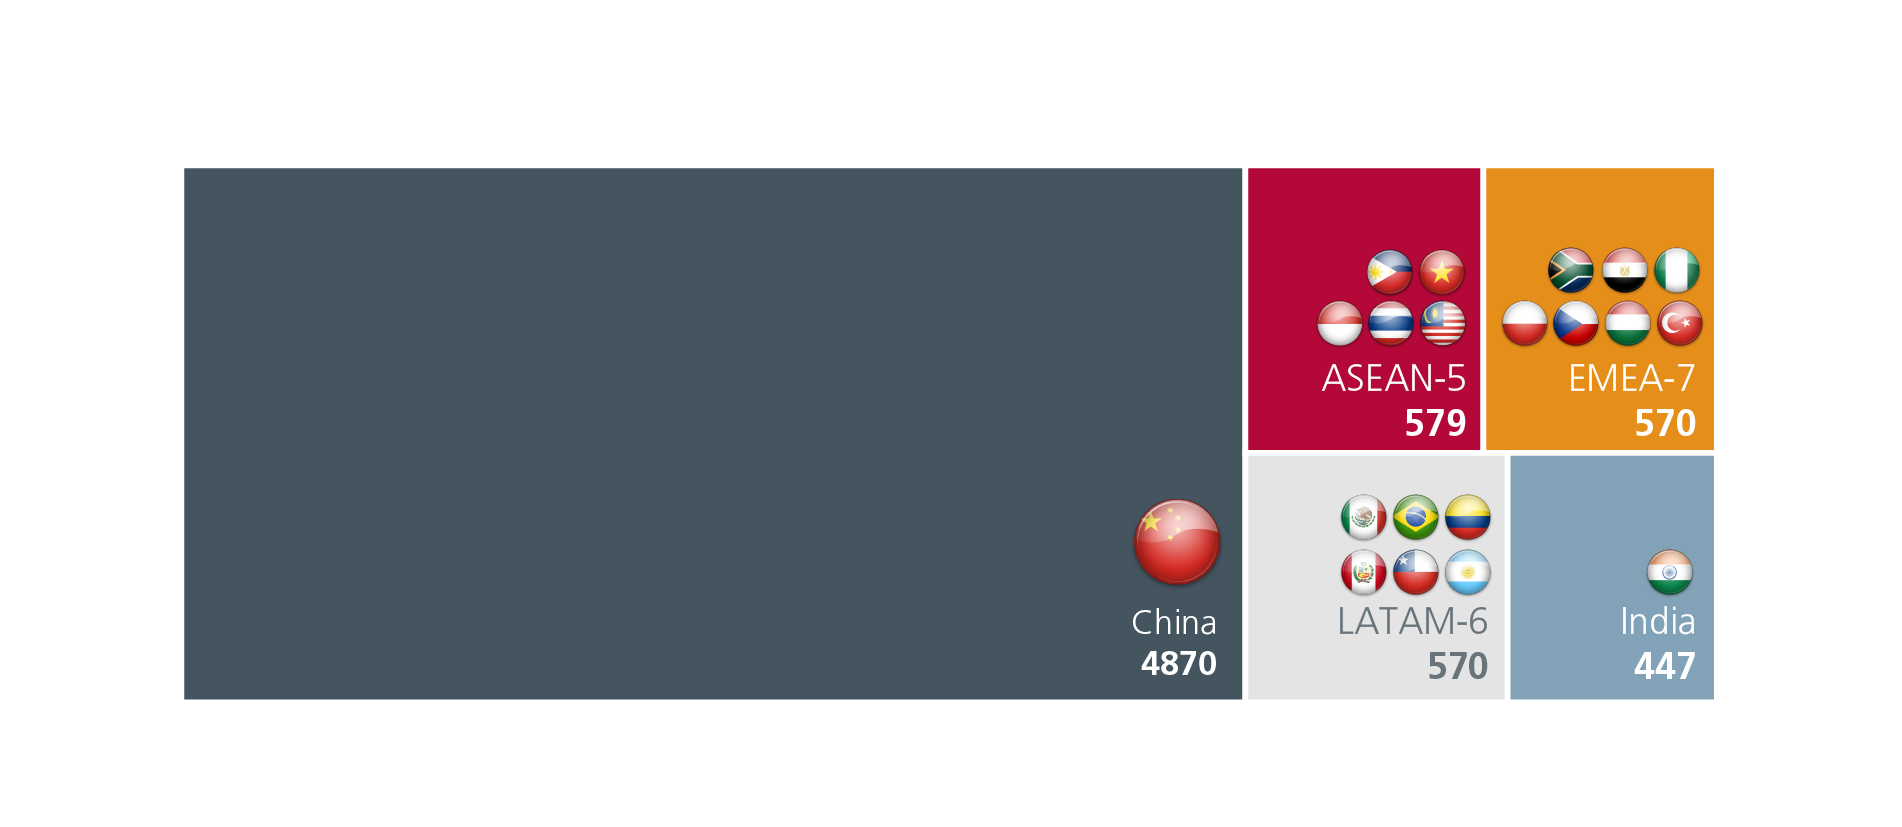
Source: World Bank. Asean-5 includes Indonesia, Thailand, Malaysia, Philippines, and Vietnam. Latam-6 includes Mexico, Brazil, Colombia, Peru, Chile, and Argentina. EMEA-7 includes Poland, Czechia, Hungary, Turkey, South Africa, Nigeria and Egypt.
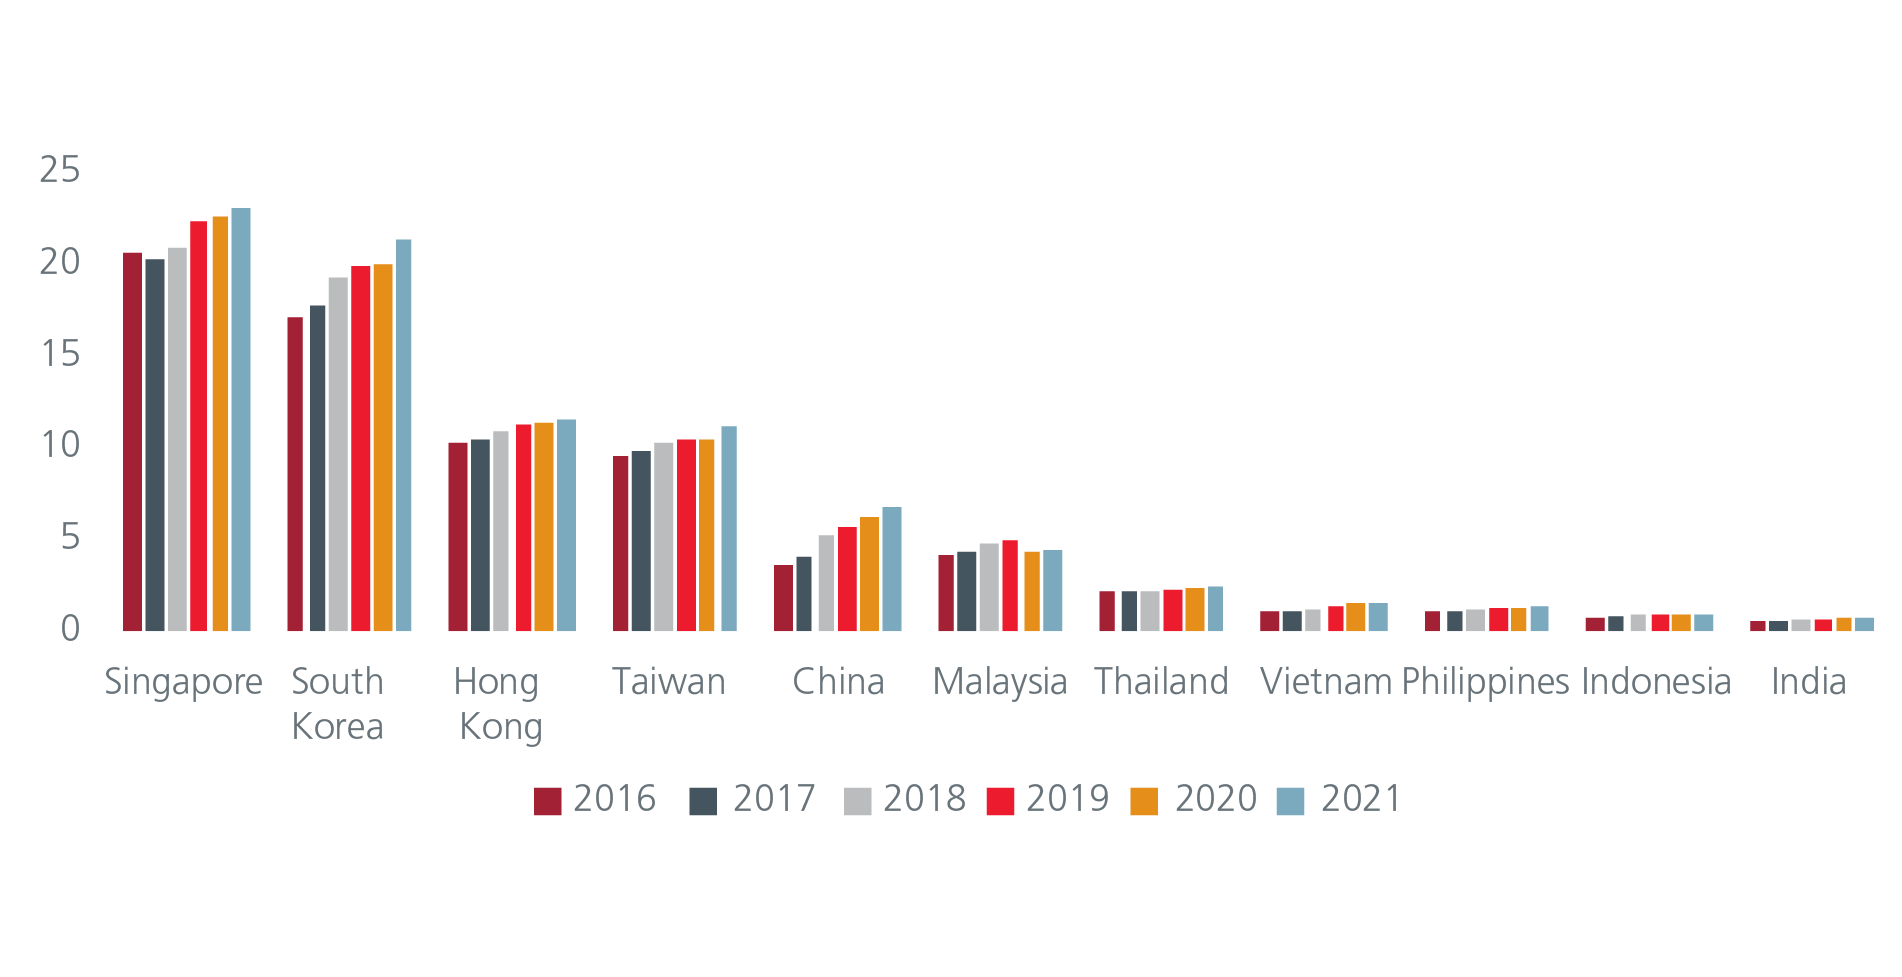
ASEAN has started to account for a growing share of global FDI and exports (Fig 7) and it already boasts of a well-established supply chain for the electric vehicle (EV) industry. The economic vitality of ASEAN has also strengthened notably with robust growth in technology investments, especially in semiconductor start-ups. ASEAN’s appeal as a manufacturing hub is further enhanced by its attractive consumer market, thanks to favourable demographics.
Fig. 7. ASEAN’s growing share of global FDI
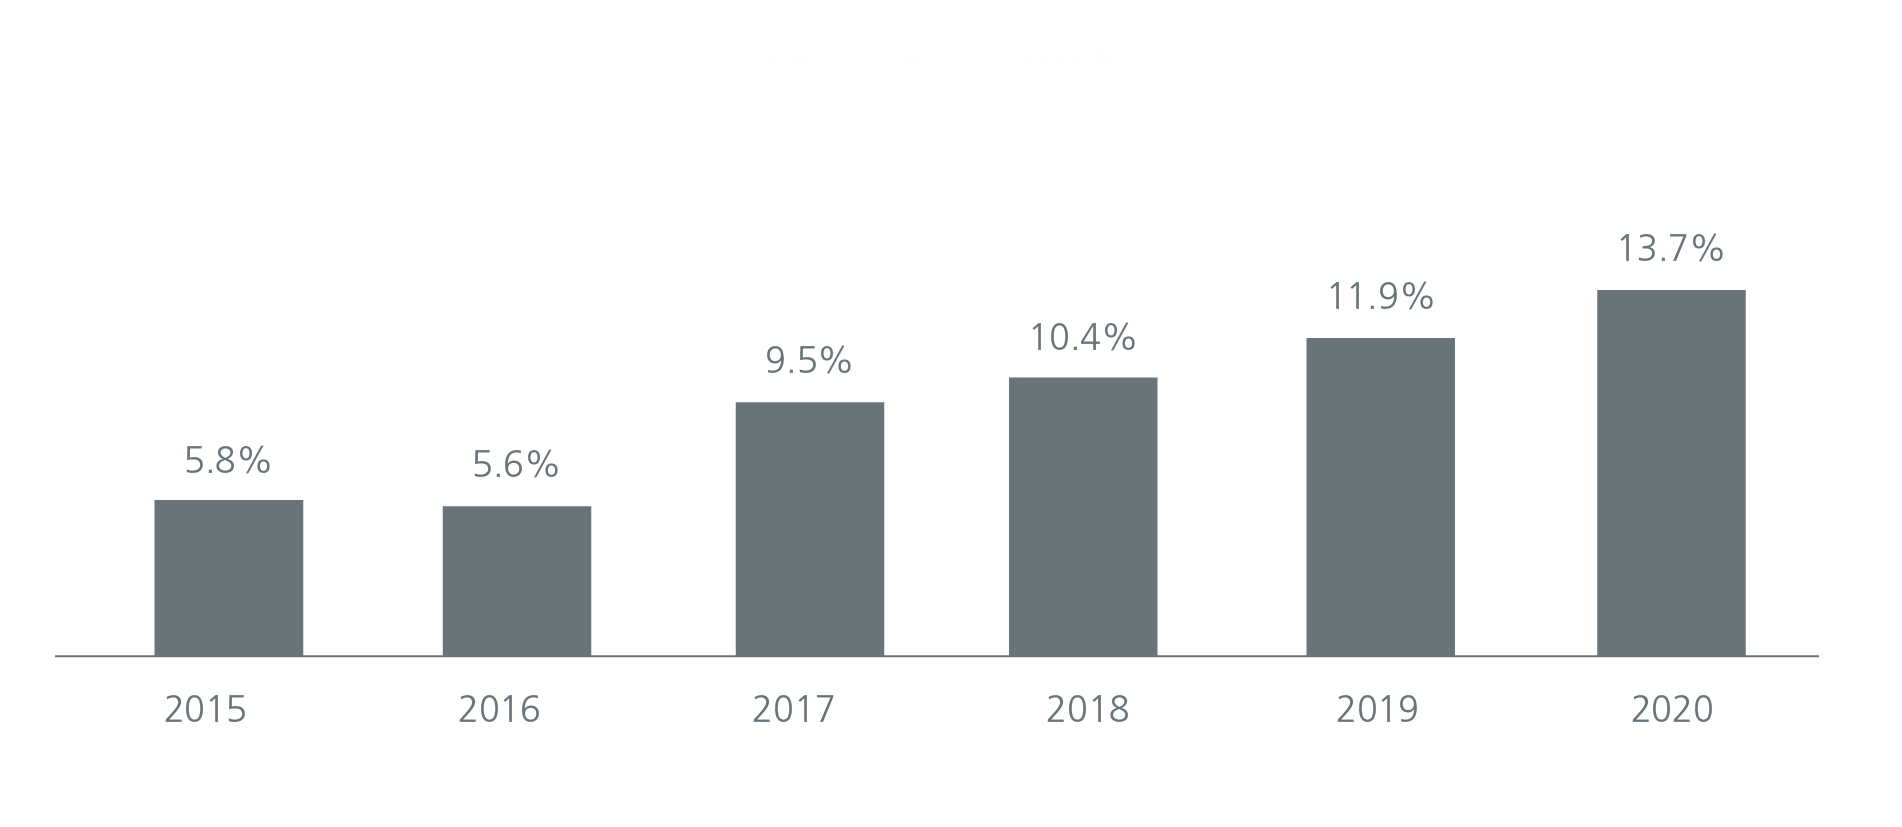
Source: ASEAN Secretariat, ASEAN FDI database. Sept 2021.
In Latin America, Mexico is the ‘Nearshoring’ leader given its geographical proximity to the US, robust manufacturing capability, ample labour pool and important natural resources (energy, copper, lithium). FDI into Mexico has been robust since 2013 and ramped up in 2022 reflective of a strong ‘Nearshoring’ trend. Furthermore, Mexico benefits from free trade agreements with the US. Mexican exports to the US have been rising since the start of the US-China trade war and more recently, Mexico overtook China to become the biggest exporter to the US in the first half of 2023. Fig.8. The rest of Latin America is rich in lithium and copper which are key materials for EV and renewable energy, making the region an attractive destination for foreign investments.
Fig. 8. Mexico’s exports to the US rising
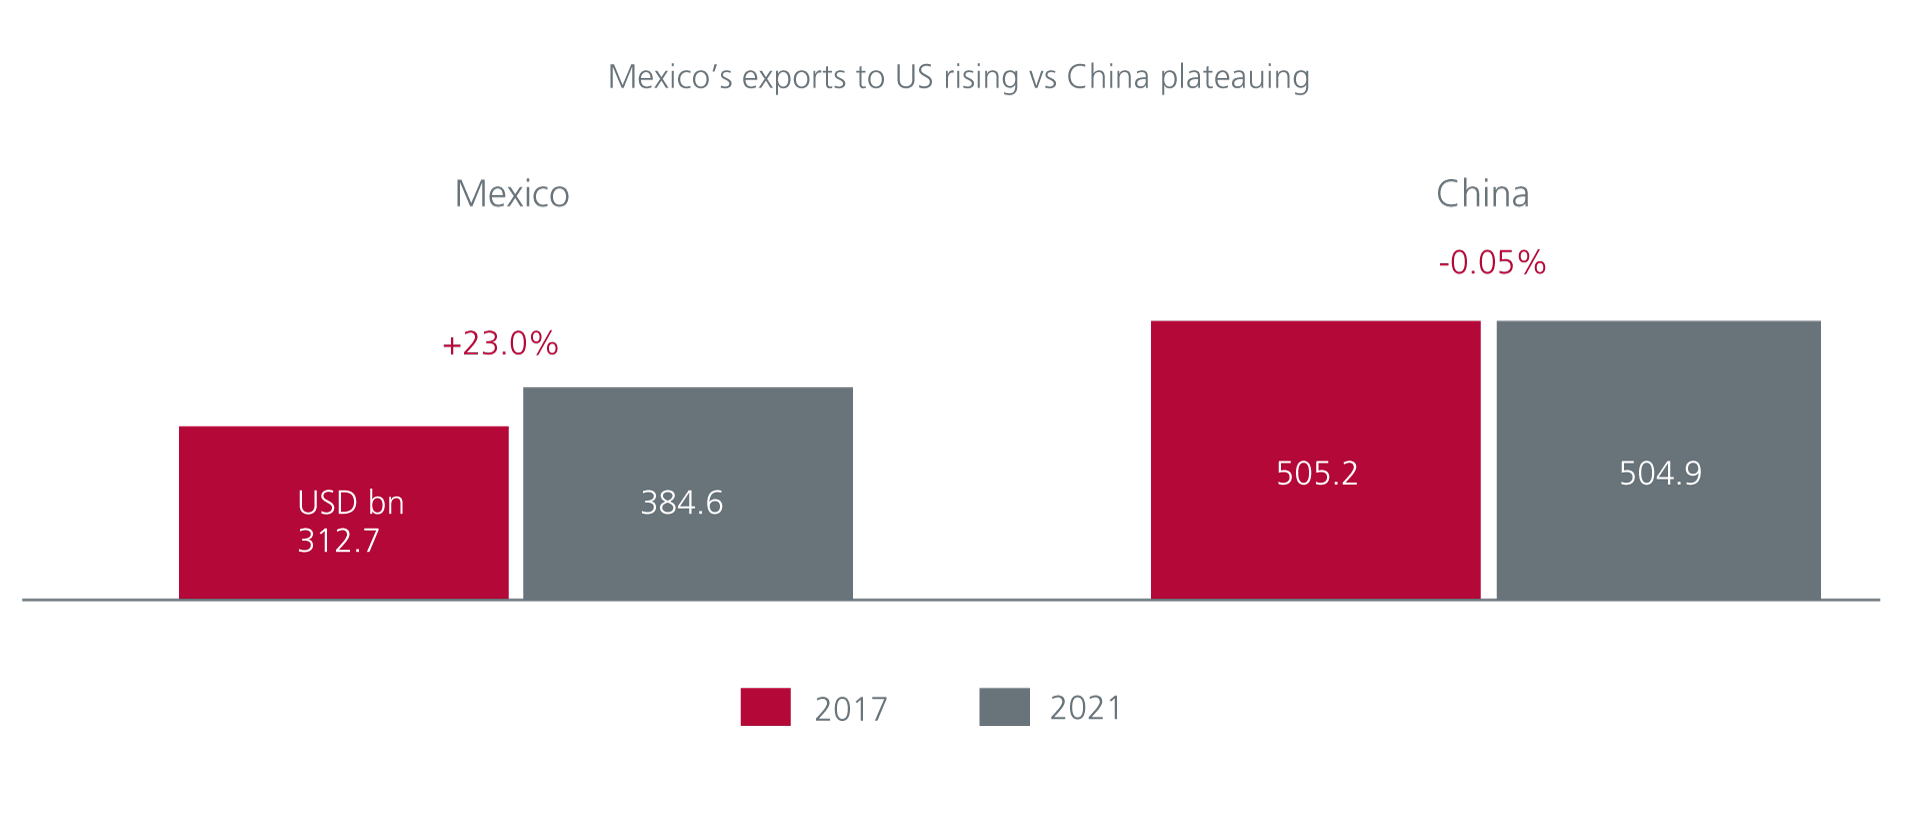
Source: USITC. Nov 2022.
India has one of the best demographic profiles in the world which in turn provides a source of abundant labour and growing consumption base. The Indian government is also supporting the manufacturing sector with a series of measures such as corporate tax rate cuts, production linked incentives (‘Make in India’) and its National Infrastructure Pipeline. The Indian manufacturing sector is likely to continue to see strong growth in exports and inflows of foreign investments, such as the recent expansion plans by iPhone maker Hon Hai.
EMEA (Emerging Europe, Middle East and Africa) has similar attractive demographics and manufacturing bases. The CE3 countries (Poland, Hungary and Czechia) and Turkey have very competitive manufacturing bases and will benefit from ‘Nearshoring’ trends of companies from advanced European economies as well as multinational companies. Africa has the fastest growing and youngest population in the world and is adding half of the world’s population between 2020 and 2030. It is also expected to have a combined consumer and business spending of USD6.7 trillion by 2030 and USD16 trillion by 2050.
How to invest in the Great Transition
Higher costs, geopolitical concerns and the desire for increased supply chain resilience and security are causing global companies to diversify and seek alternative manufacturing facilities nearer home or within like-minded allies. Apple’s pivot to India, Tesla’s major factory in Mexico and Samsung’s investments in Vietnam are evidence that this supply chain transition is underway. This presents a once-in-a-generation opportunity for Emerging Market countries that have the necessary resources and readiness. For investors, we believe that much of the opportunities reside in small to mid-capitalisation stocks, which would be best uncovered via a disciplined, fundamentally-driven stock-picking investment approach.
Access expert analysis to help you stay ahead of markets.
- Follow
-

-

-

Interesting reads


Sources:
1 Beijing National Bureau of Statistics.
2 Moody’s Analytics. September 2023.
3 EY Industrial Supply Chain Survey, 2022.
4 CEIC, US China Business Council, June 2022 survey.
Singapore by Eastspring Investments (Singapore) Limited (UEN: 199407631H)
Australia (for wholesale clients only) by Eastspring Investments (Singapore) Limited (UEN: 199407631H), which is incorporated in Singapore, is exempt from the requirement to hold an Australian financial services licence and is licensed and regulated by the Monetary Authority of Singapore under Singapore laws which differ from Australian laws
Hong Kong by Eastspring Investments (Hong Kong) Limited and has not been reviewed by the Securities and Futures Commission of Hong Kong.
Indonesia by PT Eastspring Investments Indonesia, an investment manager that is licensed, registered and supervised by the Indonesia Financial Services Authority (OJK).
Malaysia by Eastspring Investments Berhad (200001028634/ 531241-U) and Eastspring Al-Wara’ Investments Berhad (200901017585 / 860682-K) and has not been reviewed by Securities Commission of Malaysia.
Thailand by Eastspring Asset Management (Thailand) Co., Ltd.
United States of America (for institutional clients only) by Eastspring Investments (Singapore) Limited (UEN: 199407631H), which is incorporated in Singapore and is registered with the U.S Securities and Exchange Commission as a registered investment adviser.
European Economic Area (for professional clients only) and Switzerland (for qualified investors only) by Eastspring Investments (Luxembourg) S.A., 26, Boulevard Royal, 2449 Luxembourg, Grand-Duchy of Luxembourg, registered with the Registre de Commerce et des Sociétés (Luxembourg), Register No B 173737.
Chile (for institutional clients only) by Eastspring Investments (Singapore) Limited (UEN: 199407631H), which is incorporated in Singapore and is licensed and regulated by the Monetary Authority of Singapore under Singapore laws which differ from Chilean laws.
The afore-mentioned entities are hereinafter collectively referred to as Eastspring Investments.
The views and opinions contained herein are those of the author, and may not necessarily represent views expressed or reflected in other Eastspring Investments’ communications. This document is solely for information purposes and does not have any regard to the specific investment objective, financial situation and/or particular needs of any specific persons who may receive this document. This document is not intended as an offer, a solicitation of offer or a recommendation, to deal in shares of securities or any financial instruments. It may not be published, circulated, reproduced or distributed without the prior written consent of Eastspring Investments. Reliance upon information in this document is at the sole discretion of the reader. Please carefully study the related information and/or consult your own professional adviser before investing.
Investment involves risks. Past performance of and the predictions, projections, or forecasts on the economy, securities markets or the economic trends of the markets are not necessarily indicative of the future or likely performance of Eastspring Investments or any of the funds managed by Eastspring Investments.
Information herein is believed to be reliable at time of publication. Data from third party sources may have been used in the preparation of this material and Eastspring Investments has not independently verified, validated or audited such data. Where lawfully permitted, Eastspring Investments does not warrant its completeness or accuracy and is not responsible for error of facts or opinion nor shall be liable for damages arising out of any person’s reliance upon this information. Any opinion or estimate contained in this document may subject to change without notice.
Eastspring Investments companies (excluding joint venture companies) are ultimately wholly owned/indirect subsidiaries of Prudential plc of the United Kingdom. Eastspring Investments companies (including joint venture companies) and Prudential plc are not affiliated in any manner with Prudential Financial, Inc., a company whose principal place of business is in the United States of America or with the Prudential Assurance Company Limited, a subsidiary of M&G plc (a company incorporated in the United Kingdom).