


Executive Summary
- Behavoural biases tend to become more pronounced when markets are volatile. The disposition effect is a behavioural bias where investors hold onto losing investments for too long and sell winning investments too quickly.
- A stop loss tool can provide an unbiased approach to prompt the sale of losing investments and help protect investment performance. Such a tool can be incorporated into investment teams’ overall risk management framework.
- Our stop loss signal effectively identifies stocks that are likely to continue declining over the 12-month period after the initial trigger. Even if these stocks recover, the benefits of avoiding the decline outweigh the potential gains.
Behavioural biases can lead to irrational decision-making and suboptimal investment performance. With the heightened market gyrations in the recent months, these biases can become more pronounced. We can use data to assess and manage the effect of different behavioural biases and develop tools that can be incorporated into investment teams’ overall risk management frameworks.
Holding losers and selling winners
Among the different biases, the disposition effect stands out. The disposition effect is a behavioural bias where investors tend to hold onto losing investments for too long and sell winning investments too quickly. This can lead to suboptimal investment performance by locking in losses and missing out on potential gains. Imagine yourself as an investor who buys a stock at $100. As the stock price falls to $80, you hesitate to sell, hoping for a recovery. This reluctance to sell is driven by the desire to avoid realising a loss, even though holding onto the stock may lead to further declines. Conversely, if the stock rises to $120, you might sell quickly to lock in gains, missing out on further potential gains.
This occurs because the psychological discomfort of realising a loss can be more painful than the joy of realising a gain. According to the study by Kahneman and Tversky (1979)1 , the pain of losses is felt approximately twice as strongly as the pleasure of equivalent gains. This phenomenon, known as loss aversion, explains why investors may hold onto losing stocks for too long, hoping for a turnaround that may never come.
For fundamental investment teams, the disposition effect is particularly relevant. These investors conduct deep dives on areas such as business model, company management, and competitive position before making an investment decision. A natural attachment and conviction to the decision is likely to develop. This conviction, coupled with the loss aversion effect, can make it challenging to confront a weakening stock position.
By understanding and acknowledging the presence of the disposition effect, fundamental investors can incorporate a data-informed process that supports rational decisions about when to reduce or exit weakening positions. This is where a stop loss tool can support, providing an unbiased approach to prompt the sale of losing investments and help protect investment performance.
Calibrating an effective stop loss signal
Typical stop loss usage involves a one-size-fits-all loss level, for example -20%, which is easy to communicate as a process but impractical. Our approach leverages on one of the core premises in a published research paper2, which is to use volatility as a predictor for stop loss thresholds. This avoids the need to make strong distributional assumptions and, most importantly, accounts for the differences across stocks.
However, we adapted the volatility calibration to use stock returns relative to the market, rather than stock returns themselves. We find that this helps to reduce noise from broad market movements and contextualises the usage for portfolios managed against a performance benchmark.
Our methodology involves two key components: the rolling active volatility calculation and the stop loss signal trigger. We calculate the rolling active volatility using a rolling window of active returns. This helps to determine the fluctuation of a stock’s performance relative to the index . By using a rolling window, we can capture the dynamic nature of market conditions and adjust our volatility estimates accordingly. This is relevant because it allows us to understand how volatile a security’s active returns are, which is crucial for setting appropriate stop loss thresholds.
Measuring volatility of performance deviation to market returns is essential because it helps identify unusual movements specific to the stock, differentiating them from market trends where all other stocks are moving similarly. For instance, if the entire market is experiencing a downturn, a stock's decline may not be seen as unusual. However, if the stock declines significantly more than the broader market, it may indicate that something unusual is happening to that particular stock. Focusing on relative returns volatility helps us to better identify these unusual stock movements and enable us to set more representative stop loss thresholds.
If a stock has high relative returns volatility, it may be more prone to sharp declines. By calculating the rolling active volatility, we can set a stop loss threshold that is sensitive to these fluctuations, prompting timely review of weakening positions. This gives the investment teams an opportunity to review the investment thesis, leading them to either reduce or exit the position, or to add to the position if the stock price shows unwarranted weakness.
A stop loss signal is triggered when the active return falls below a threshold, which is determined by a carefully calibrated scaling factor multiplied by the rolling active volatility. This approach ensures that the stop loss signal is sensitive to changes in market conditions and the specific behaviour of the security.
Helping our investment teams sell better
To evaluate the effectiveness of our stop loss strategy, we asked ourselves – “What would the stock performance have been if we did not exit at the point of trigger?” We measure the consequences using performance of the stock relative to the broad market, over the period of 1/3/6/12 months after the event.
This helps us evaluate whether the hypothetical stop loss discipline was effective in mitigating the disposition effect.
The results are encouraging. We review the hypothetical outcomes at the 12 months mark after the trigger of the signal, a time horizon which is more representative to a fundamental investment style. See Fig. 1.
Fig. 1. MSCI AC Asia Pacific ex Japan post stop out performance
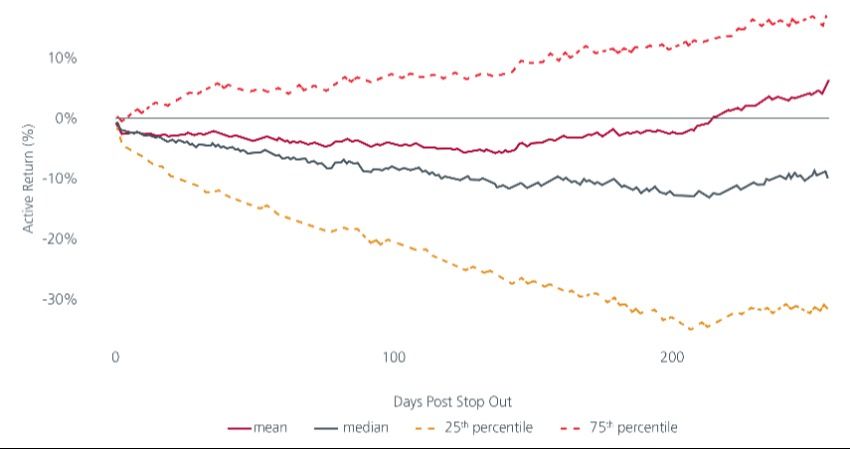
Source: Eastspring Investments, April 2025.
Fig. 1. shows the stocks’ performance after they have triggered the stop loss signal. For every stock, we track its respective performance relative to the broad market, right from the second day after it crosses the stop loss threshold, up to one year later. To evaluate the effectiveness of the signal across all the stocks in the study, we sample representative segments of the observations. The 75th percentile represents ‘stocks that recovered’ while the 25th percentile represents ‘stocks that continued falling’. To understand the entire distribution of outcomes, we also study the Mean and Median, which represents ‘the average stock’.
The ‘stocks that continued falling’ (-32% after one year) consistently declined by more than the ‘stocks that recovered’ (+17% after one year) . This means that even if stocks recovered after the unusual tumble that triggered the stop loss signal, the amount of recovery did not outweigh the benefits of avoiding a decline which might have been larger.
The Median stock (-10%) also underperforms the broad market, with the Mean (+6%) delivering neutral performance against the broad market. This does not include the opportunity cost of not reinvesting the capital into a higher conviction stock, which could mean forgoing higher potential returns. Hence, if we are consistent in using this signal, a stock which has crossed the stop loss threshold is an undesirable candidate in the portfolio as it is unlikely to outperform the broad market even up to 12 months after.
Another helpful metric we used for assessing the effectiveness of the signal was the Hit-Rate, which measures how often the stop loss signal correctly identifies stocks that will underperform the index. This metric informs us on “how often are you likely to be correct?”. According to this, our stop loss signal has an average Hit-Rate of 65%; out of every 100 instances, 65 stocks will go on to underperform the broad market.
These findings indicate that the stop loss signal is helpful in identifying stocks that are likely to continue declining. Incorporating this signal into the investment process can enhance risk management as well as tactically protect alpha in the long run. Even if the decision is to continue holding the position, it would have been informed by both data as well as a healthy debate.
By prompting a timely review of these stocks, the stop loss signal is an unbiased tool which helps investors mitigate the disposition effect and can potentially free up capital in the portfolio for deployment in other more promising stocks.
Protecting portfolio alpha
Our stop loss signal aims to help our investment teams not hold onto losing investments for too long or sell winning investments too quickly. We calibrate our signals so that they are sensitive to changes in market conditions and the specific behaviour of the security.
Through testing, we see that our stop loss signal can identify stocks that are likely to continue declining, or even when they recover, the amount of outperformance did not outweigh the benefits of avoiding a decline. With a respectable Hit-Rate of 65%, our investment teams are encouraged to incorporate such an overlay in their portfolio and risk management process.
The stop loss signal is an unbiased tool that can inculcate discipline in reviewing underperforming stocks, thereby helping to mitigate the investment teams’ behavioural biases and protect the alpha in their portfolios.
Access expert analysis to help you stay ahead of markets.
- Follow


Interesting reads


Sources:
1 Kahneman, D., & Tversky, A. (1979). Prospect Theory: An Analysis of Decision under Risk. Econometrica, 47(2), 263-291.
2 Adam Y.C. Lei,a,* Huihua Lib (2009). The value of stop loss strategies. Financial Services Review 18, 23–51.
Singapore by Eastspring Investments (Singapore) Limited (UEN: 199407631H)
Australia (for wholesale clients only) by Eastspring Investments (Singapore) Limited (UEN: 199407631H), which is incorporated in Singapore, is exempt from the requirement to hold an Australian financial services licence and is licensed and regulated by the Monetary Authority of Singapore under Singapore laws which differ from Australian laws
Hong Kong by Eastspring Investments (Hong Kong) Limited and has not been reviewed by the Securities and Futures Commission of Hong Kong.
Indonesia by PT Eastspring Investments Indonesia, an investment manager that is licensed, registered and supervised by the Indonesia Financial Services Authority (OJK).
Malaysia by Eastspring Investments Berhad (200001028634/ 531241-U) and Eastspring Al-Wara’ Investments Berhad (200901017585 / 860682-K) and has not been reviewed by Securities Commission of Malaysia.
Thailand by Eastspring Asset Management (Thailand) Co., Ltd.
United States of America (for institutional clients only) by Eastspring Investments (Singapore) Limited (UEN: 199407631H), which is incorporated in Singapore and is registered with the U.S Securities and Exchange Commission as a registered investment adviser.
European Economic Area (for professional clients only) and Switzerland (for qualified investors only) by Eastspring Investments (Luxembourg) S.A., 26, Boulevard Royal, 2449 Luxembourg, Grand-Duchy of Luxembourg, registered with the Registre de Commerce et des Sociétés (Luxembourg), Register No B 173737.
Chile (for institutional clients only) by Eastspring Investments (Singapore) Limited (UEN: 199407631H), which is incorporated in Singapore and is licensed and regulated by the Monetary Authority of Singapore under Singapore laws which differ from Chilean laws.
The afore-mentioned entities are hereinafter collectively referred to as Eastspring Investments.
The views and opinions contained herein are those of the author, and may not necessarily represent views expressed or reflected in other Eastspring Investments’ communications. This document is solely for information purposes and does not have any regard to the specific investment objective, financial situation and/or particular needs of any specific persons who may receive this document. This document is not intended as an offer, a solicitation of offer or a recommendation, to deal in shares of securities or any financial instruments. It may not be published, circulated, reproduced or distributed without the prior written consent of Eastspring Investments. Reliance upon information in this document is at the sole discretion of the reader. Please carefully study the related information and/or consult your own professional adviser before investing.
Investment involves risks. Past performance of and the predictions, projections, or forecasts on the economy, securities markets or the economic trends of the markets are not necessarily indicative of the future or likely performance of Eastspring Investments or any of the funds managed by Eastspring Investments.
Information herein is believed to be reliable at time of publication. Data from third party sources may have been used in the preparation of this material and Eastspring Investments has not independently verified, validated or audited such data. Where lawfully permitted, Eastspring Investments does not warrant its completeness or accuracy and is not responsible for error of facts or opinion nor shall be liable for damages arising out of any person’s reliance upon this information. Any opinion or estimate contained in this document may subject to change without notice.
Eastspring Investments companies (excluding joint venture companies) are ultimately wholly owned/indirect subsidiaries of Prudential plc of the United Kingdom. Eastspring Investments companies (including joint venture companies) and Prudential plc are not affiliated in any manner with Prudential Financial, Inc., a company whose principal place of business is in the United States of America or with the Prudential Assurance Company Limited, a subsidiary of M&G plc (a company incorporated in the United Kingdom).