


Executive Summary
- In a world where market dynamics are shifting and uncertainty is rising, active investing is no longer a preference but a necessity.
- This is especially so in Asia, where rising market and sector concentration within the MSCI Asia ex Japan Index potentially exposes passive investors to more risk than they realise.
- Active investors have the flexibility to seek out less popular stocks as well as opportunities outside the index. Historically in Asia, these stocks have traded at more attractive valuations and delivered rewarding outcomes.
The debate between active and passive investing is not new. But in today’s market, it deserves renewed attention. While passive investing—largely through index-tracking Exchange Traded Funds (ETFs)—offers simplicity and cost efficiency, the evolution of dominant market themes and new layers of complexity, particularly around trade and supply chains, demand a more active approach when investing in Asia.
Passive investing: Hidden risks
Passive investing’s low fees and broad market exposure have made it popular with investors. ETFs tracking indexes like MSCI AC Asia ex Japan allow investors to participate in the region’s opportunities without the need for deep research. But this efficiency comes with a cost.
As capital flows into passive vehicles, it creates a feedback loop. Larger companies—already prominent in the index—receives more inflows, which pushes their valuations higher, thereby reinforcing their dominance in the index. The result is a market that is increasingly driven by a handful of names. The chart below shows that since 2024, the largest companies in the Asia ex Japan investment universe have increasingly driven the region’s performance.
Fig. 1. Asia ex Japan universe* return contribution by the largest 5% of constituents

Source: Analysis window: 1 June 2020 to 30 June 2025. *Our proprietary Asia ex-Japan investment universe comprises stocks drawn from major indices—including S&P BMI Global, MSCI ACWI, MSCI Frontier, JCI, FTSE Bursa 100, among others (non-exhaustive). This universe is further refined to include only stocks listed in the following countries: Hong Kong, Singapore, China, India, Indonesia, South Korea, Malaysia, Philippines, Taiwan, Thailand, Bangladesh, Pakistan, Sri Lanka, and Vietnam.
This concentration introduces real risk. When a few companies account for a disproportionate share of the index performance, any weakness in those names can potentially drag down an entire portfolio. The top 10 constituents in the MSCI AC Asia ex Japan Index now account for 40% of the index’s risk. Fig. 2. Investors who thought they were buying “the market” are actually exposed to a narrow slice of it – nearly 40% of allocation in risk budget terms are coming from just 10 stocks, representing a mere 1% by count!
Fig. 2. MSCI AC Asia ex Japan index - risk contribution by the largest 10 constituents
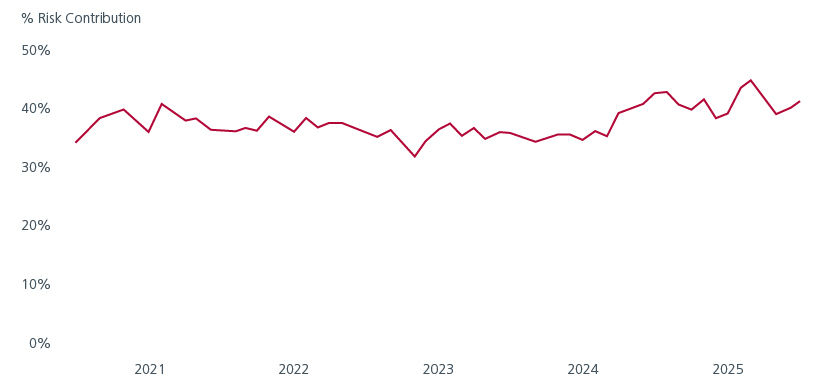
Source: Analysis window: 1 June 2020 to 30 June 2025. Axioma Fundamental Asia Pacific ex Japan Medium-Horizon.
Is the index still the market?
The assumption that an index represents the market is becoming less valid.
When we break down the index by country and sector, the concentration becomes even more apparent. Countries like China and Taiwan, and sectors such as Information Technology and Financials, account for the bulk of the exposure. Fig 3 and 4. This is not representative of the diverse Asia ex Japan opportunity set.
Fig. 3. MSCI AC Asia ex Japan Index – weight of largest 3 countries
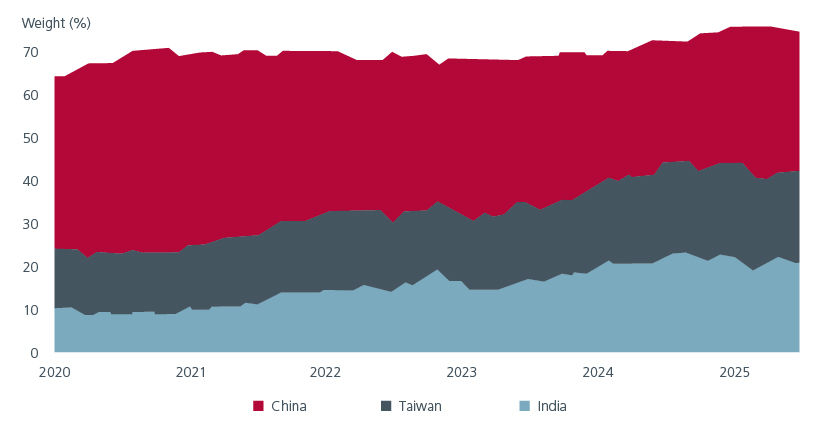
Source: Largest 3 countries by weight in MSCI AC Asia ex Japan index as of end-June 2025. Analysis window June 2020 to June 2025.
Fig. 4. MSCI AC Asia ex Japan Index – weight of largest 3 sectors
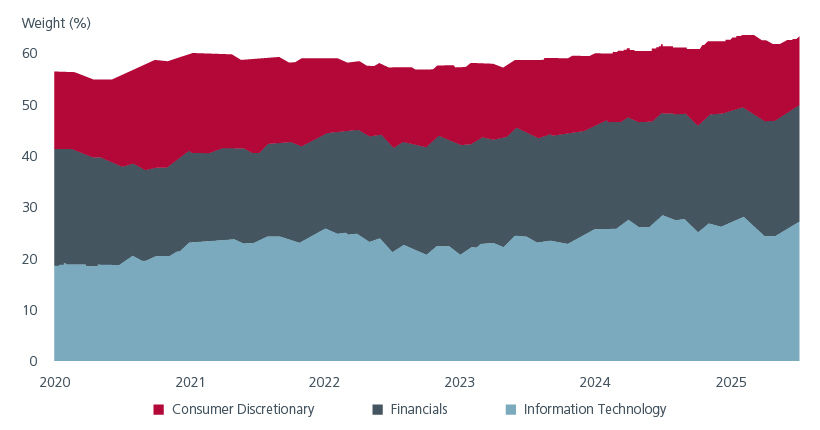
Source: Largest 3 GICS Sector by weight in MSCI AC Asia ex Japan index as of end-June 2025. Analysis window: June 2020 to June 2025.
The rising country and sector concentration in the MSCI AC Asia ex Japan index suggests that investors may be better off with an active approach; looking beyond the “popular” stocks as well as exploring opportunities outside the index. These opportunities often come with more attractive valuations.
Consider price-to-book (PB) – a simple measure of how much investors pay for a company’s net assets. Fig. 5 shows that the largest index constituents often trade at elevated price-to-book ratios, reflecting their popularity and perceived safety, while the smaller capitalised stocks tend to have lower P/B valuations.
Fig. 5. Trailing 12 months price-to-book (PB) across market-cap segments
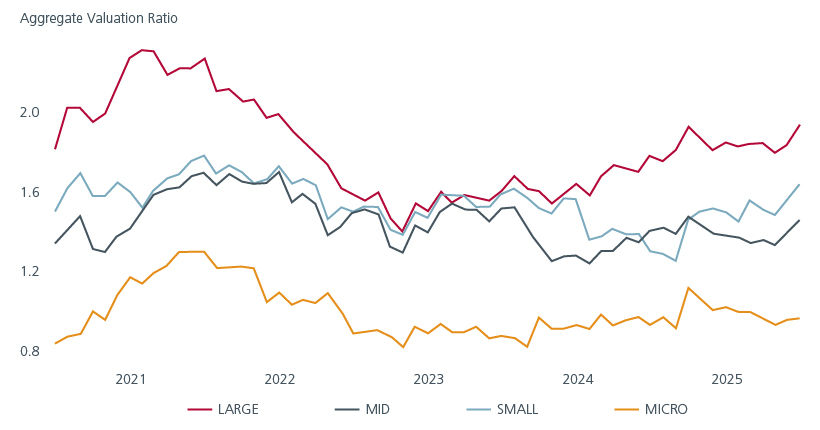
Source: Market cap segments are defined using typical index methodology. Companies are ranked from largest to smallest based on their total market capitalization. Then, using free float-adjusted market cap, the segments are as follows – Large: Constituents cumulatively making up 70% of the total free float-adjusted market cap, Mid Cap: up to 85%, Small Cap: up to 99%, Micro Cap: remaining 1%. July 2025. Analysis window: 1 June 2020 to 30 June 2025.
But do valuations matter? As wise sayings go, price is not the same as value.
We analysed the forward 1-year returns of the stocks within the MSCI AC Asia ex Japan index for the period between June 2020 to June 2024, categorising each stock according to their Value and Growth characteristics. Fig. 6.
- The top row represents the more expensive companies
- The left-most column represents companies with stronger growth characteristics
The average outcome from the expensive stocks (top two rows) is a loss of 2.7%. On the other hand, stocks which were more attractively valued (bottom two rows), delivered an average gain of 6.3%. In fact, the more attractively valued stocks delivered positive returns across all levels of growth potential, with the highest return of 10.1% coming from cheaply valued companies with the strongest growth characteristics. It is worth noting that expensive stocks, regardless of their growth potential, had lower returns.
This analysis shows that valuations matter and often, paying a premium for companies does not bring superior outcomes, regardless of their perceived growth potential.
Fig. 6. 1-year forward returns of stocks in the MSCI AC Asia ex Japan Index
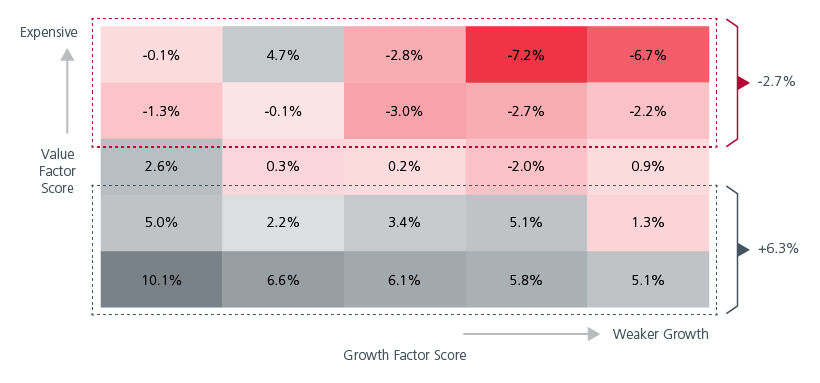
Source: Securities in our proprietary Asia ex-Japan universe are split into 25 fractiles based on their Value and Growth factor scores. Equal-weighted 1-year forward active returns, relative to MSCI AC Asia ex Japan index, are calculated for each fractile. Value Factor Score: Proprietary blend of valuation-related measures. Growth Factor Score: Proprietary blend of various growth, sentiment and valuation measures. July 2025. Analysis window: 1 June 2020 to 30 June 2025.
Navigating uncertainty: Why active now
2025 has been a year of surprises. Traditional market relationships have broken down. Defensive sectors have underperformed during risk-off periods. Currency movements have defied interest rate differentials. These anomalies suggest that historical playbooks may no longer apply.
The MSCI AC Asia ex Japan Index is increasingly concentrated and likely exposed to thematic hype. In this environment, active management is no longer a preference but a necessity. Active managers can interpret geopolitical developments, assess supply chain vulnerabilities, and anticipate policy shifts. They can adjust portfolios dynamically, manage risk proactively rather than being tethered to index weights.
For investors seeking long-term returns in Asia, the case for active management has never been stronger.
Interesting reads


Singapore by Eastspring Investments (Singapore) Limited (UEN: 199407631H)
Australia (for wholesale clients only) by Eastspring Investments (Singapore) Limited (UEN: 199407631H), which is incorporated in Singapore, is exempt from the requirement to hold an Australian financial services licence and is licensed and regulated by the Monetary Authority of Singapore under Singapore laws which differ from Australian laws
Hong Kong by Eastspring Investments (Hong Kong) Limited and has not been reviewed by the Securities and Futures Commission of Hong Kong.
Indonesia by PT Eastspring Investments Indonesia, an investment manager that is licensed, registered and supervised by the Indonesia Financial Services Authority (OJK).
Malaysia by Eastspring Investments Berhad (200001028634/ 531241-U) and Eastspring Al-Wara’ Investments Berhad (200901017585 / 860682-K).
Thailand by Eastspring Asset Management (Thailand) Co., Ltd.
United States of America (for institutional clients only) by Eastspring Investments (Singapore) Limited (UEN: 199407631H), which is incorporated in Singapore and is registered with the U.S Securities and Exchange Commission as a registered investment adviser.
European Economic Area (for professional clients only) and Switzerland (for qualified investors only) by Eastspring Investments (Luxembourg) S.A., 26, Boulevard Royal, 2449 Luxembourg, Grand-Duchy of Luxembourg, registered with the Registre de Commerce et des Sociétés (Luxembourg), Register No B 173737.
Chile (for institutional clients only) by Eastspring Investments (Singapore) Limited (UEN: 199407631H), which is incorporated in Singapore and is licensed and regulated by the Monetary Authority of Singapore under Singapore laws which differ from Chilean laws.
The afore-mentioned entities are hereinafter collectively referred to as Eastspring Investments.
The views and opinions contained herein are those of the author, and may not necessarily represent views expressed or reflected in other Eastspring Investments’ communications. This document is solely for information purposes and does not have any regard to the specific investment objective, financial situation and/or particular needs of any specific persons who may receive this document. This document is not intended as an offer, a solicitation of offer or a recommendation, to deal in shares of securities or any financial instruments. It may not be published, circulated, reproduced or distributed without the prior written consent of Eastspring Investments. Reliance upon information in this document is at the sole discretion of the reader. Please carefully study the related information and/or consult your own professional adviser before investing.
Investment involves risks. Past performance of and the predictions, projections, or forecasts on the economy, securities markets or the economic trends of the markets are not necessarily indicative of the future or likely performance of Eastspring Investments or any of the funds managed by Eastspring Investments.
Information herein is believed to be reliable at time of publication. Data from third party sources may have been used in the preparation of this material and Eastspring Investments has not independently verified, validated or audited such data. Where lawfully permitted, Eastspring Investments does not warrant its completeness or accuracy and is not responsible for error of facts or opinion nor shall be liable for damages arising out of any person’s reliance upon this information. Any opinion or estimate contained in this document may subject to change without notice.
Eastspring Investments companies (excluding joint venture companies) are ultimately wholly owned/indirect subsidiaries of Prudential plc of the United Kingdom. Eastspring Investments companies (including joint venture companies) and Prudential plc are not affiliated in any manner with Prudential Financial, Inc., a company whose principal place of business is in the United States of America or with the Prudential Assurance Company Limited, a subsidiary of M&G plc (a company incorporated in the United Kingdom).