

Audrey Choi
CFA, Portfolio Manager
Michael (Xiaochen) Sun
Director, Quant Capability,
Client Portfolio Manager,
Quantitative Strategies,
Eastspring Investments
Executive Summary
- Index rebalancing is a major market event that can cause temporary supply-demand imbalances, creating risks and opportunities for investors.
- Index rebalancing effects are persistent and vary by region, requiring both active and passive managers to understand and adapt to local market conditions.
- Market maturity and arbitrage infrastructure are crucial in shaping how markets respond to index changes.
Over the past two decades, passive investment strategies have become an integral part of global capital markets, complementing active management, and helping investors achieve a range of objectives. While active strategies seek to deliver alpha by outperforming benchmarks through security selection and market timing, passive strategies offer broad market exposure, cost efficiency, and transparency. Both approaches are integral to portfolio construction, whether implemented through a core-satellite model or a diversified total portfolio approach. Their coexistence reflects the evolving needs of institutional and intermediary investors.
The rapid growth of passive investing, alongside the widespread adoption of exchange traded funds (ETFs), has significantly reshaped market dynamics. By the end of 2024, total net assets in ETFs reached $14.85 trillion1, highlighting the scale and influence of index-tracking vehicles in global markets. This expansion has introduced new structural features into equity markets, including more predictable trading patterns and implementation frictions that can influence short-term price movements, particularly around systematic events such as index rebalancing.
Index rebalancing is one of the most significant systematic events in today’s equity markets. When index providers like MSCI announce benchmark changes, passive funds are required to rebalance their portfolios at the market close prior to the new index taking effect. This index reconstitution process can create temporary supply-demand imbalances for stocks with changing weights, presenting both risks and opportunities for market participants.
As a manager of both active and passive strategies, we recognise the importance of understanding these dynamics, not only to optimise execution and minimise costs for passive portfolios, but also to identify opportunities for active strategies to add value in the face of predictable market flows.
Understanding index rebalancing dynamics
The impact of index rebalancing is based on a set of core principles that influence how markets respond during rebalancing events.
First, the price pressure hypothesis suggests that large, predictable trades associated with index changes can temporarily push prices away from fundamental values. Research shows that stocks targeted by hedge fund arbitrage strategies tend to outperform their peers by 0.86% per month before rebalancing events2, demonstrating how informed traders can anticipate and capitalise on these mechanical flows.
Second, the market efficiency hypothesis suggests that developed markets with greater active trading tend to have smaller and shorter-lived price distortions. In contrast, for markets where there are fewer active traders, and lower liquidity, price distortions from index rebalancing can be larger and persist for longer periods.
Separately, there are transaction costs involved for passive funds given the requirement for these funds to trade in response to index changes at a fixed time. These costs are not necessarily visible when comparing an index fund’s returns to its benchmark as they are embedded in the performance of the indices.3
While extensive research has examined these dynamics in developed markets, there remains relatively limited coverage of developing markets, particularly in Asia Pacific ex-Japan (APxJ). This research gap is increasingly relevant as Asian markets grow in importance within global portfolios and exhibit unique characteristics, such as lower liquidity and efficiency.
As experts in Asia, we aim to address this gap by providing a comprehensive analysis of index rebalancing dynamics across major global regions, with a particular emphasis on APxJ markets. Our analysis goes beyond price impact patterns to explore optimal execution strategies tailored to varying market conditions. As a result, we are able to quantify the opportunities available to active managers seeking to exploit these inefficiencies and passive managers seeking to minimise implementation costs. This empowers investors to make more informed decisions and unlock potential “technical alpha” arising from predictable flow dynamics.
Analysis of rebalancing effects
Perfomance dynamics
Our analysis reveals consistent patterns of temporary price pressure around index rebalancing dates across all regions, with notable variations in magnitude and persistence.
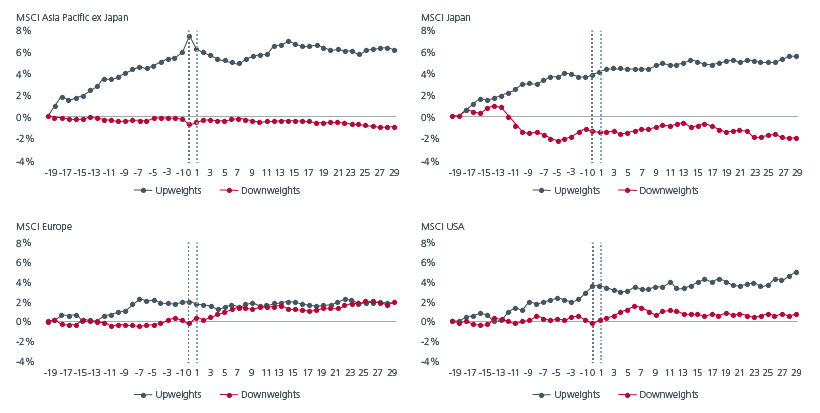
Fig 1 illustrates the average weighted active returns of upweighted versus downweighted stocks across four regional indices, aggregated over all rebalancing points since 2020. The vertical black dotted line marks the index rebalance date (i.e. the actual trade date, 0 day on x-axis), while the vertical blue dotted line marks index effective date (typically the market-on-close price on the effective date).
In most markets, we observe a recurring pattern whereby upweighted stocks outperform their respective country benchmarks relative to downweighted stocks in the days leading up to the rebalancing date. The effect is particularly pronounced in APxJ markets, where upweighted stocks exhibit a sharp spike in performance relative to downweighted stocks around the rebalancing window, followed by swift reversals.
Fig. 1. Average active returns of upweighted vs downweighted stocks on index rebalancing dates since 2000
Source: Data from MSCI & Eastspring Investments
This behaviour suggests a greater degree of market inefficiency in APxJ compared to more developed markets such as the US and Japan, where active market participants and liquidity providers are more effective in anticipating passive flows. This effect has shown remarkable consistency over time across APxJ, Japan, and US markets.
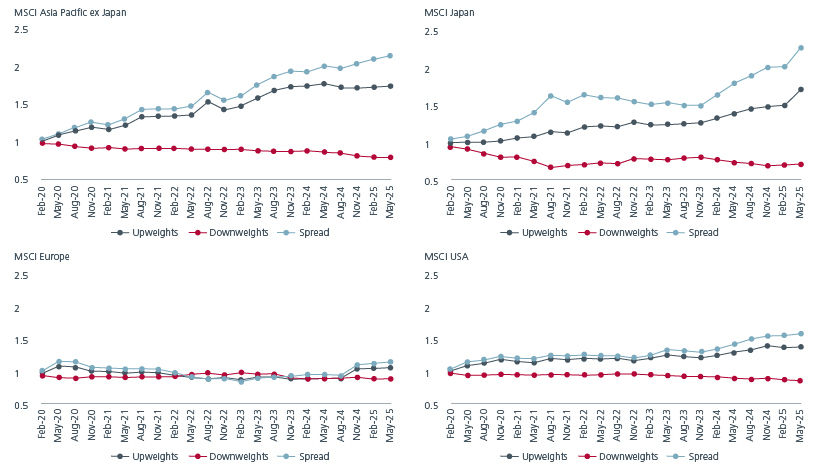
Fig 2 presents cumulative weighted active return spreads for each rebalancing period, offering a time-series view of the persistence and magnitude of these patterns. In contrast, MSCI Europe shows less consistent patterns, reflecting the complexity of its multi-country, multi-currency composition and fragmented market structure.
Fig. 2. Cumulative active returns of upweighted vs downweighted stocks on all index rebalancing dates since 2020
Source: Data from MSCI & Eastspring Investments.
The patterns reflect supply-demand imbalances from passive funds rebalancing at close of the prior day before index changes are effected, driving predictable buying and selling pressure. In markets with fewer active arbitrageurs, such as APxJ, this pressure often leads to pronounced price dislocations.
This imbalance is due to the closing auction on the day before the index change to align with the index calculation methodology. Passive managers, aiming to minimise tracking error, concentrate trades at the close, often overwhelming liquidity especially in less liquid markets.
Post rebalancing performance varies by region; in the US and Japan, upweighted stocks often outperform modestly due to ongoing fundamentals and a broader base of marginal buyers following their index inclusion, while downweighted ones slightly lag due to selling pressure from passive funds exiting positions. In contrast, APxJ and Europe typically show rapid mean reversion, indicating that initial price moves are driven more by temporary liquidity effects than fundamentals, reflecting the short-term dislocations from concentrated passive flows.
Execution outcomes
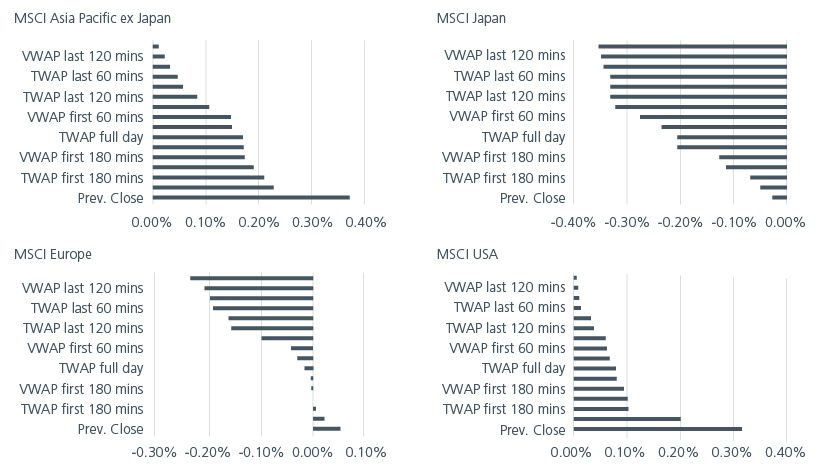
Our analysis shows that the market impact of passive flows during closing auctions on index rebalancing dates varies by region. We assess execution performance by comparing weighted average price differences across benchmarks such as Time Weighted Average Price (TWAP) and Volume Weighted Average Price (VWAP) versus the traditional close execution. These benchmarks are measured at various times during the trading day (e.g., near open, intraday, near close), with weights normalised based on each stock’s index weight change to ensure comparability.
As shown in Fig 3, close execution outperforms other benchmarks in Europe and Japan, suggesting that even with elevated volume, closing auctions effectively absorb large rebalancing flows. This may reflect these markets’ ability to match passive flows with sufficient counterparties during the closing auctions. In contrast, close execution underperforms in the US and APxJ, indicating that concentrated trading at the market close imposes significant market impact costs. This suggests that spreading trades throughout the day or using alternative execution strategies could improve implementation performance.
Notably, this result is somewhat counterintuitive: while the US is highly efficient and APxJ is more fragmented, both require highly tailored execution solutions to manage rebalancing flows effectively. In the case of the US, this may reflect the influence of its large and diverse ETF market, where many vehicles do not require strict market-on-close execution like traditional index funds. Additionally, sophisticated institutional investors may deliberately avoid crowded closing auctions, further diluting the effectiveness of close-based execution.
Fig 3: Performance comparison across execution benchmarks on index rebalancing dates
Source: Data from MSCI, LSEG & Eastspring Investments
Regional differences in execution outcomes can be attributed to several factors: variations in market structure, the presence of active and sophisticated arbitrageurs, differing liquidity patterns in markets, and time zone effects. Markets with robust auction mechanisms and active participants are better equipped to absorb predictable passive flows, while markets that close during active trading hours in other major regions may benefit from cross-border arbitrage and broader liquidity.
Key takeaways
Index rebalancing effects are a persistent feature of modern equity markets, varying significantly by region and market structure. As passive investing continues to grow, understanding its market impact is increasingly vital for both active and passive managers. While passive strategies offer cost efficiency and broad diversification, they also introduce challenges that demand adaptive, region-specific approaches.
Our findings highlight how systematic trading from passive flows creates predictable supply-demand imbalances, leading to both risks and opportunities that investment professionals must navigate in today’s complex and interconnected markets. Furthermore, the regional variations in optimal execution strategies highlight the importance of adapting implementation approaches to local market characteristics rather than applying a uniform global strategy.
These documented market impacts raise broader questions about index design and rebalancing practices. Simple rules, such as trading ahead of index funds or delaying reconstitution trades by 3 to 12 months, can add up to 23 basis points a year4. Index providers may wish to consider modifications that reduce market impact while preserving index integrity.
Our findings offer actionable guidance for passive manager seeking to optimise trade execution strategies. In markets where close execution underperforms, managers should consider:
- Spreading trades across multiple time periods
- Using TWAP or VWAP strategies over extended periods
- Leveraging opening auction mechanisms where appropriate
- Implementing gradual accumulation strategies in the days leading up to the rebalance
The supply-demand imbalances created by index rebalancing events represent meaningful opportunities for both active and passive managers as summarised in Fig 4.
Fig. 4. Actionable guidance for active and passive managers
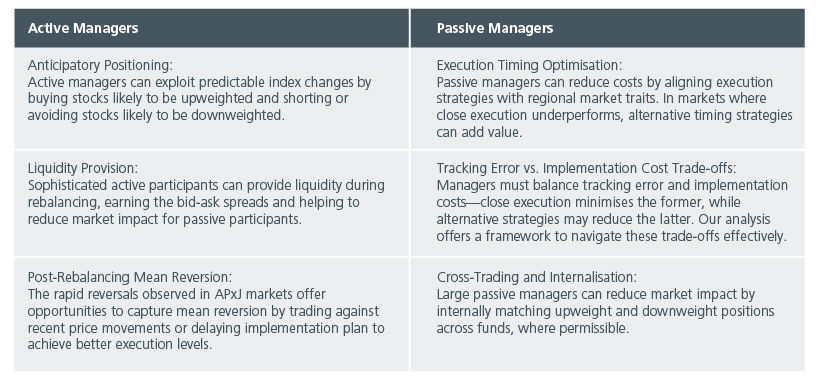
Source: Eastspring Investments
The pronounced effects observed in APxJ markets, relative to more developed markets, suggest that market development and arbitrage infrastructure play key roles in determining the magnitude of index rebalancing impacts. As these markets continue to evolve and attract more sophisticated participants, it is reasonable to expect the observed effects may moderate over time in line with the principles of efficient market theory. However, the ongoing expansion of passive strategies, particularly in emerging markets with less developed arbitrage infrastructure, suggests that these dynamics will remain relevant for the foreseeable future.
Appendix
Data source
Our analysis utilises comprehensive MSCI index rebalancing data, covering four major regional indices: Asia Pacific ex-Japan (APxJ), Japan, Europe, and USA. MSCI typically releases proforma indices approximately two weeks before the index effective date, allowing market participants to anticipate the required rebalancing trades. In addition to the proforma index data, we also sourced intraday trades data from LSEG to measure execution performance on index rebalance dates. For each rebalancing event, we identify stocks experiencing the largest weight changes, defined as those in the top and bottom 20th percentiles by magnitude of weight change. This approach focuses on the stocks most likely to experience significant price impact from passive rebalancing flows. We focus on the period from 2020 onwards, which includes both normal market conditions and the significant volatility associated with the COVID-19 pandemic. The consistency of our results across different market environments suggests that the documented patterns reflect structural features of index rebalancing, such as benchmark driven trading behaviour, rather than temporary phenomena.
Performance Measurement Methodology
We calculate the weighted active returns of rebalancing stocks relative to their country benchmarks, scaled by the magnitude of their index weight changes between the old and new compositions. This approach allows us to assess the economic significance of price effects in proportion to the size of the required trading activity. For execution analysis, we compare performance across several trading benchmarks including Time-Weighted Average Price (TWAP) and Volume-Weighted Average Price (VWAP), measured at different time intervals: near the market open, throughout the trading day, and near the market close. We calculate both weighted averages and medians of the difference between executing at alternative benchmarks and the traditional market at close execution, adjusting for the direction of each stock’s weight change. For example, if a stock is being added or increased in weight, we deem trading earlier is better if and only if various trading benchmarks are lower than the close price on index rebalance date.
Market Characteristics
Asia Pacific ex-Japan (APxJ) markets exhibit varying levels of development. Some markets are characterised by limited liquidity in secondary trading and a smaller pool of active institutional participants. This creates potential for greater price impact from systematic flows.
Japan is a developed market with sophisticated institutional participation. However, it features a unique market structure, including concentrated trading hours and specific auction mechanisms.
Europe includes developed markets with strong institutional participation and established arbitrage mechanisms. Nonetheless, its market structure remains fragmented across multiple exchanges and jurisdictions.
US is the most liquid and efficiently arbitraged market globally, supported by extensive institutional participation and advanced market-making capabilities.
References
Agarwal, V., Fos, V., & Jiang, W. (2013). Inferring reporting-related biases in hedge fund databases from hedge fund equity holdings. Management Science, 59(6), 1271-1289.
Arnott, R. D., Brightman, C., Kalesnik, V., & Wu, L. (2023). Earning alpha by avoiding the index rebalancing crowd. Financial Analysts Journal, 79(2), 76–97.
Ben-David, I., Franzoni, F., & Moussawi, R. (2018). Do ETFs increase volatility? The Journal of Finance, 73(6), 2471-2535. Brown, D. C., Davies, S. W., & Ringgenberg, M. C. (2021). ETF arbitrage, non-fundamental demand, and return predictability. Review of Finance, 25(4), 937-972.
Dannhauser, C. D., & Pontiff, J. (2019). Flow. Working paper, Boston College.
Dimensional Fund Advisors. (2024). Measuring the costs of index reconstitution: A global perspective. Dimensional Fund Advisors Research.
Gabaix X, Koijen R. In Search of the Origins of Financial Fluctuations: The Inelastic Markets Hypothesis [Working Paper]. 2023.Petajisto, A. (2011). The index premium and its hidden cost for index funds. Journal of Empirical Finance, 18(2), 271-288.
Sammon, M., & Shim, J. (2025). Index rebalancing and stock market composition. Working paper.
Interesting reads


Sources:
1 https://etfgi.com/news/press-releases/2025/02/eassets-invested-global-etfs-industry-surpassed-hedge-fund
2 Wang, G. J., Yao, C. Y., & Yelekenova, A. (2023). ETF rebalancing, hedge fund trades, and capital market. https://dx.doi.org/10.2139/ssrn.4324054
3 Petajisto, A. (2011). The index premium and its hidden cost for index funds. Journal of Empirical Finance, 18(2), 271–288.
4 Arnott, R. D., Brightman, C., Kalesnik, V., & Wu, L. (2023). Earning alpha by avoiding the index rebalancing crowd. Financial Analysts Journal, 79(2), 76–97.
Singapore by Eastspring Investments (Singapore) Limited (UEN: 199407631H)
Australia (for wholesale clients only) by Eastspring Investments (Singapore) Limited (UEN: 199407631H), which is incorporated in Singapore, is exempt from the requirement to hold an Australian financial services licence and is licensed and regulated by the Monetary Authority of Singapore under Singapore laws which differ from Australian laws
Hong Kong by Eastspring Investments (Hong Kong) Limited and has not been reviewed by the Securities and Futures Commission of Hong Kong.
Indonesia by PT Eastspring Investments Indonesia, an investment manager that is licensed, registered and supervised by the Indonesia Financial Services Authority (OJK).
Malaysia by Eastspring Investments Berhad (200001028634/ 531241-U) and Eastspring Al-Wara’ Investments Berhad (200901017585 / 860682-K).
Thailand by Eastspring Asset Management (Thailand) Co., Ltd.
United States of America (for institutional clients only) by Eastspring Investments (Singapore) Limited (UEN: 199407631H), which is incorporated in Singapore and is registered with the U.S Securities and Exchange Commission as a registered investment adviser.
European Economic Area (for professional clients only) and Switzerland (for qualified investors only) by Eastspring Investments (Luxembourg) S.A., 26, Boulevard Royal, 2449 Luxembourg, Grand-Duchy of Luxembourg, registered with the Registre de Commerce et des Sociétés (Luxembourg), Register No B 173737.
Chile (for institutional clients only) by Eastspring Investments (Singapore) Limited (UEN: 199407631H), which is incorporated in Singapore and is licensed and regulated by the Monetary Authority of Singapore under Singapore laws which differ from Chilean laws.
The afore-mentioned entities are hereinafter collectively referred to as Eastspring Investments.
The views and opinions contained herein are those of the author, and may not necessarily represent views expressed or reflected in other Eastspring Investments’ communications. This document is solely for information purposes and does not have any regard to the specific investment objective, financial situation and/or particular needs of any specific persons who may receive this document. This document is not intended as an offer, a solicitation of offer or a recommendation, to deal in shares of securities or any financial instruments. It may not be published, circulated, reproduced or distributed without the prior written consent of Eastspring Investments. Reliance upon information in this document is at the sole discretion of the reader. Please carefully study the related information and/or consult your own professional adviser before investing.
Investment involves risks. Past performance of and the predictions, projections, or forecasts on the economy, securities markets or the economic trends of the markets are not necessarily indicative of the future or likely performance of Eastspring Investments or any of the funds managed by Eastspring Investments.
Information herein is believed to be reliable at time of publication. Data from third party sources may have been used in the preparation of this material and Eastspring Investments has not independently verified, validated or audited such data. Where lawfully permitted, Eastspring Investments does not warrant its completeness or accuracy and is not responsible for error of facts or opinion nor shall be liable for damages arising out of any person’s reliance upon this information. Any opinion or estimate contained in this document may subject to change without notice.
Eastspring Investments companies (excluding joint venture companies) are ultimately wholly owned/indirect subsidiaries of Prudential plc of the United Kingdom. Eastspring Investments companies (including joint venture companies) and Prudential plc are not affiliated in any manner with Prudential Financial, Inc., a company whose principal place of business is in the United States of America or with the Prudential Assurance Company Limited, a subsidiary of M&G plc (a company incorporated in the United Kingdom).