


Executive Summary
- As traditional diversification between equities and bonds are proving less reliable in periods of market stress, investors are increasingly using Risk Management Overlays (RMOs) to limit portfolio drawdowns.
- A three pillar RMO approach i.e. Direct Hedging, Proxy Hedging and Carry Strategies is complementary and helps to mitigate risk without significantly compromising long-term returns
- RMOs represent a practical and robust enhancement to conventional portfolio construction, particularly in an environment of shifting macroeconomic correlations and increasing tail risks.
Investors have long allocated capital based on their expectations of future returns, volatilities and correlations, anchored in the principle that diversification across uncorrelated assets enhances a portfolio’s stability and reduces risk. This concept underpins the construction of multi-asset portfolios which usually comprise equities and bonds.
These two asset classes have historically moved in opposite directions, providing a natural hedge and supporting the long-standing resilience of the traditional 60/40 portfolio. However, recent events like the market dislocations of 2022 - when both equities and bonds fell in tandem amid aggressive central bank rate hikes—revealed that this negative correlation can break down.
Such breakdowns have highlighted the need for more robust risk management frameworks with investors increasingly turning to hedging strategies to protect against drawdowns.
Understanding and evaluating market drawdowns
A robust risk management framework must account for the nature and dynamics of market breakdowns, recognising how they emerge and evolve over time.
Key drawdown metrics include:
- Maximum drawdown – the peak-to-trough decline in portfolio value.
- Drawdown duration – the time from peak to trough.
- Recovery time – the time taken to recover from a drawdown back to the previous peak.
Drawdowns can vary significantly in form:
- Sharp drawdowns, such as the COVID-19 crash in early 2020, are sudden and severe
- Gradual drawdowns, like those during the 2022 rate-hiking cycle, unfold over time and can be more persistent.
Understanding drawdowns and their characteristics is essential in designing effective risk management overlays (RMO) for different market stress scenarios.
Hedging tail risks via risk management overlays
While hedges can protect against losses, they often come with a cost that erodes long-term performance. Yet, for many investors—particularly institutions with drawdown constraints—choosing not to hedge is not a viable option. This is where risk management overlays (RMOs) come into play.
RMOs are risk mitigating hedging strategies applied on top of a portfolio to hedge tail risks without compromising long-term returns of the portfolio. Rather than relying on a single hedge which can be expensive, a RMO is a structured hedging approach that addresses different types of drawdowns, allows for cost sharing across strategies and selective deployment of capital to where it is most effective.
We propose a three-pillar framework for constructing RMOs:
- Direct Hedging
This pillar includes instruments like put options that are designed to perform during sharp market corrections. These strategies offer strong negative correlation to portfolio assets and benefit from spikes in volatility. However, they come with a consistent cost of implementation.
- Proxy Hedging
This includes strategies that perform well in more gradual drawdowns. Examples include trend-following strategies or allocations to quality equities that can better withstand downturns.
- Carry Strategy
Carry strategies that generate returns to help offset the cost of the direct hedge. The selection of these strategies excludes those that are expected to underperform during negative market environments.
Case Study: 60/40 Portfolio with RMO
To illustrate the benefits of RMOs, we applied the three-pillar approach to a US-based 60/40 portfolio (60% S&P 500, 40% US Fixed Income), back tested over the period July 2012 to April 2025.
Despite strong long-term performance, the unhedged portfolio experienced notable drawdowns—e.g., in Q1 2020 (COVID-19) and throughout 2022 (inflation-driven sell-off). The RMO-hedged portfolio was constructed with the following allocation: 50% to Direct Hedge, 20% to Proxy Hedge, and 10% to Carry.
Fig 1: Comparative performance of portfolios (unhedged versus hedged)
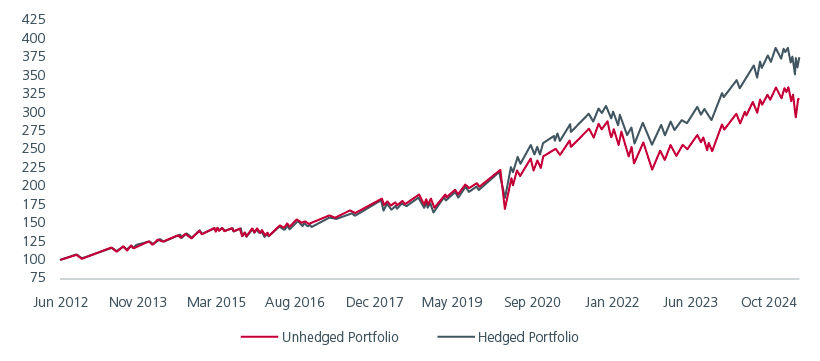
Source: Eastspring Investments and Bloomberg as of 30 April 2025
While the hedged portfolio slightly underperformed during strong up years (lagging by 50–200 bps annually), it significantly outperformed during tail-risk events, reducing drawdowns and accelerating recovery. This resulted in better risk-adjusted returns over the long term.
Fig 2: Selected statistics of drawdowns between July 2012 and April 2025
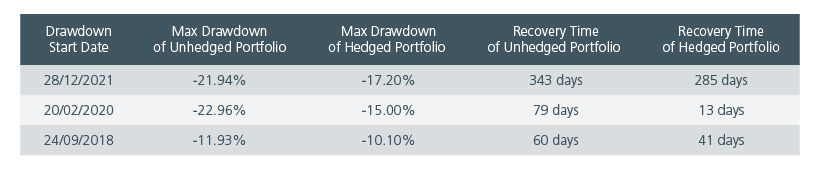
Source: Eastspring Investments and Bloomberg as of 30 April 2025
The performance metrics are better for the hedged portfolio than for the unhedged portfolio as returns are higher and realised volatility lower with shallower drawdowns.
Fig 3: Drawdown-based performance metrics
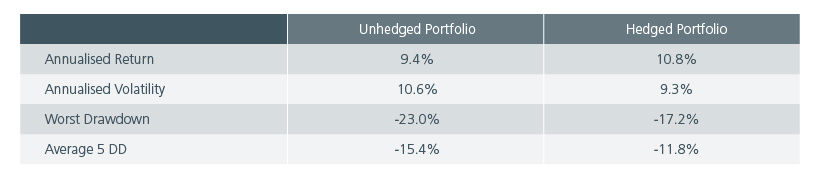
Source: Eastspring Investments and Bloomberg as of 30 April 2025
Balancing risk and return with RMOs
The three-pillar RMO framework offers a sophisticated approach to mitigating drawdowns in multi-asset portfolios. While RMOs may underperform unhedged portfolios during extended bull markets and face periods of negative contribution from proxy hedging and carry, these risks can be managed through strategic diversification and continuous performance monitoring.
Compared to traditional, options-based hedging methods, this diversified framework aims to address tail risks more effectively while minimising performance drag. As markets evolve, RMOs represent a valuable enhancement to modern portfolio construction.
Interesting reads


Singapore by Eastspring Investments (Singapore) Limited (UEN: 199407631H)
Australia (for wholesale clients only) by Eastspring Investments (Singapore) Limited (UEN: 199407631H), which is incorporated in Singapore, is exempt from the requirement to hold an Australian financial services licence and is licensed and regulated by the Monetary Authority of Singapore under Singapore laws which differ from Australian laws
Hong Kong by Eastspring Investments (Hong Kong) Limited and has not been reviewed by the Securities and Futures Commission of Hong Kong.
Indonesia by PT Eastspring Investments Indonesia, an investment manager that is licensed, registered and supervised by the Indonesia Financial Services Authority (OJK).
Malaysia by Eastspring Investments Berhad (200001028634/ 531241-U) and Eastspring Al-Wara’ Investments Berhad (200901017585 / 860682-K) and has not been reviewed by Securities Commission of Malaysia.
Thailand by Eastspring Asset Management (Thailand) Co., Ltd.
United States of America (for institutional clients only) by Eastspring Investments (Singapore) Limited (UEN: 199407631H), which is incorporated in Singapore and is registered with the U.S Securities and Exchange Commission as a registered investment adviser.
European Economic Area (for professional clients only) and Switzerland (for qualified investors only) by Eastspring Investments (Luxembourg) S.A., 26, Boulevard Royal, 2449 Luxembourg, Grand-Duchy of Luxembourg, registered with the Registre de Commerce et des Sociétés (Luxembourg), Register No B 173737.
Chile (for institutional clients only) by Eastspring Investments (Singapore) Limited (UEN: 199407631H), which is incorporated in Singapore and is licensed and regulated by the Monetary Authority of Singapore under Singapore laws which differ from Chilean laws.
The afore-mentioned entities are hereinafter collectively referred to as Eastspring Investments.
The views and opinions contained herein are those of the author, and may not necessarily represent views expressed or reflected in other Eastspring Investments’ communications. This document is solely for information purposes and does not have any regard to the specific investment objective, financial situation and/or particular needs of any specific persons who may receive this document. This document is not intended as an offer, a solicitation of offer or a recommendation, to deal in shares of securities or any financial instruments. It may not be published, circulated, reproduced or distributed without the prior written consent of Eastspring Investments. Reliance upon information in this document is at the sole discretion of the reader. Please carefully study the related information and/or consult your own professional adviser before investing.
Investment involves risks. Past performance of and the predictions, projections, or forecasts on the economy, securities markets or the economic trends of the markets are not necessarily indicative of the future or likely performance of Eastspring Investments or any of the funds managed by Eastspring Investments.
Information herein is believed to be reliable at time of publication. Data from third party sources may have been used in the preparation of this material and Eastspring Investments has not independently verified, validated or audited such data. Where lawfully permitted, Eastspring Investments does not warrant its completeness or accuracy and is not responsible for error of facts or opinion nor shall be liable for damages arising out of any person’s reliance upon this information. Any opinion or estimate contained in this document may subject to change without notice.
Eastspring Investments companies (excluding joint venture companies) are ultimately wholly owned/indirect subsidiaries of Prudential plc of the United Kingdom. Eastspring Investments companies (including joint venture companies) and Prudential plc are not affiliated in any manner with Prudential Financial, Inc., a company whose principal place of business is in the United States of America or with the Prudential Assurance Company Limited, a subsidiary of M&G plc (a company incorporated in the United Kingdom).