Summary
China’s growing dominance in the emerging market universe has portfolio implications for investors looking for diversification. While China grows as a key investment destination justifying greater attention and allocation in client portfolios, there remains a huge number of idiosyncratic opportunities across non-China emerging markets, which may justify a separate non-China emerging market allocation.
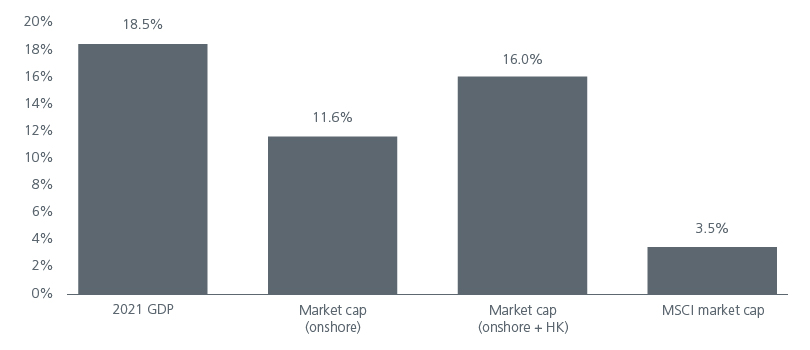
The Emerging Market (EM) equity landscape has changed materially both in size and shape. The market capitalisation of companies across EMs have been morphing, changing, rotating, but with one consistent theme, that of the growing dominance of Chinese equities. China comprises more than 30% of the MSCI EM index and continues to grow in scale, importance, and consequence. But even with this increasing dominance within Emerging Markets, it can be argued that China is still under-represented within global investment markets and investor portfolios and justifies a larger allocation as depicted in Fig 1.
Fig 1: China’s share of global GDP and market cap justifies larger equity market capitalisation
Source: World Bank, World Federation of Exchanges, MSCI, RIMES, Morgan Stanley Research 28 February 2023
When investors think about allocations to EMs, they often do so to capture the diverse return opportunities over time, of which China has now become the primary driver. The largest stocks in the MSCI EM Index have also become more and more Chinese centric. As a single country becomes dominant in an equity index, investors tend to move to discrete allocations to that country. This creates demand for a new regional construct to ensure the investment opportunity set does not shrink.
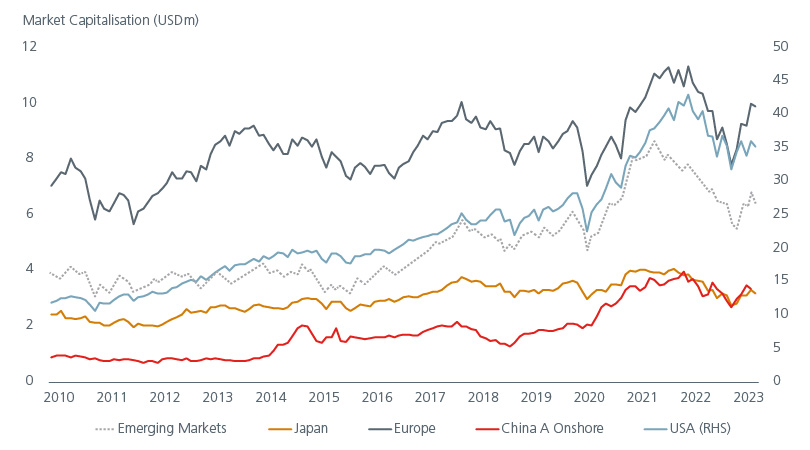
Where single countries dominate, such as US in the MSCI World Index, investors have made discrete allocations to that market which has supported the growing popularity of the World ex US Index and EAFE (Europe, Australasia, and Far East) indices. We believe that China and the MSCI EM Index may follow a similar path. We also note that China’s market capitalisation is now well above levels of Japan 10 years ago, a market which has long had discrete allocations. See Fig. 2.
Fig 2: China’s market cap now larger than Japan
Source: Bloomberg, MSCI, Eastspring Investments as of 28 February 2022
China’s index dominance crowds out alpha opportunities
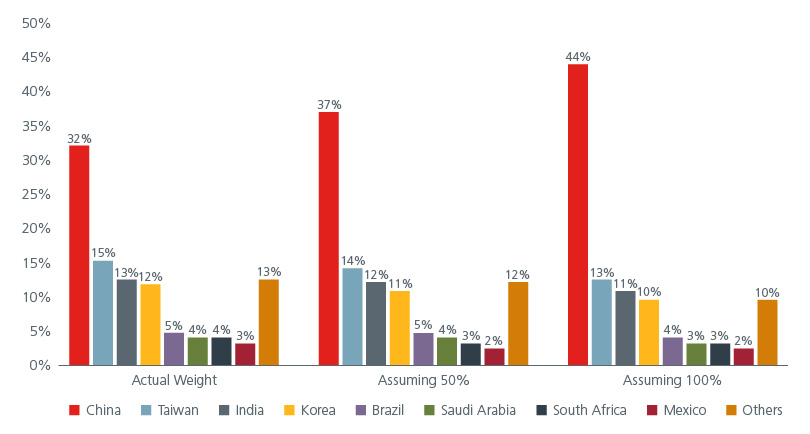
China represented just 5% of the MSCI EM Index 20 years ago. As of end of 2021, it stands at 32% and forecast to rise to 44% in the next few years based on a 100% inclusion of China A shares into the index. See Fig 3. China’s rising share of the index has come at the expense of other EMs.
As China’s index weight continues to increase, it can crowd out attractive alpha opportunities. There remains a huge number of idiosyncratic opportunities across EMs ex China which justify a separate market allocation. For example, relatively recent additions to the index such as Saudi Arabia, the United Arab Emirates, Qatar, and Kuwait have been lost in the growing dominance of China.
Fig 3: Changing impact on MSCI EM index weights with China A-shares’ inclusion
Source: MSCI, RIMES, Morgan Stanley Research as of 28 February 2023
Likewise, there are many potential investment opportunities from smaller EM countries that should not be forgotten as they often fly under the radar. We still see a growing number of candidates outside of China that offer investment opportunities. Markets outside of China, which have been crowded out, offer attractive investment opportunities.
Risk of overlooking countries with attractive valuations
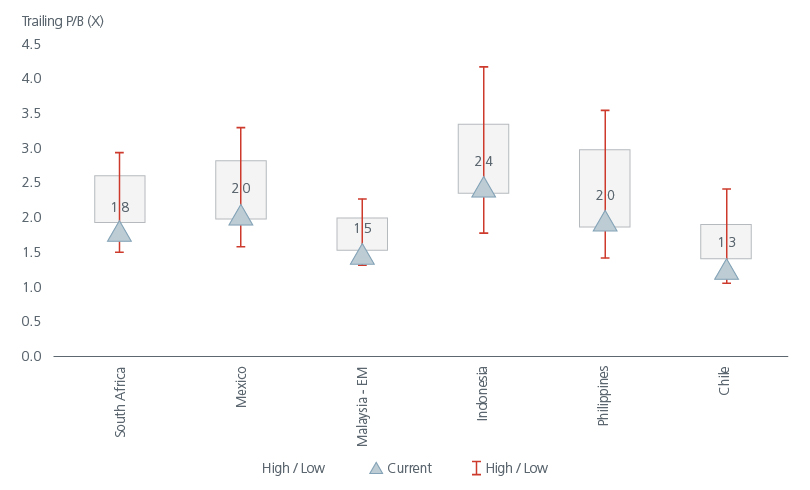
South Africa was almost 15% of the index in 2002. In 2015, the weight dropped to 6.8%. Today its share has fallen to 3.6%. Similarly, other markets such as Mexico, Malaysia, Chile etc. have experienced similar diminishing shares. What this means is that there is the risk of missing out on the attractive valuation opportunities these markets offer. See Fig 4. Based on price-to-book ratios over the last ten years, markets such as Indonesia, Malaysia, Philippines, Mexico, South Africa, and Chile are trading at very attractive levels. At current valuations, these markets will likely offer plenty of investment options.
Fig 4: Forgotten countries offer attractive valuations
Source: Factset, MSCI, Eastspring Investments, Valuations as of 31 December 2022 Notes: P/B(x) = Price-to-book ratio.
Valuations aside, there are some other notable differences when we compare the various metrics between MSCI EM Index and MSCI EM ex China Index. First, the stock count reduces from 1,375 to 6621 in EM ex China which reflects the long tail of the smaller companies in the Chinese A share market, but still offers a large universe for a bottom-up stock picker.
With regards to China specifically, while the investment opportunity remains attractive, the ongoing US-China tensions and the pressure from the West about China’s stance on the Russia-Ukraine conflict may continue to impact Chinese corporates. Companies and governments are already diversifying their supply chains to reduce reliance on China. As such an EM ex China allocation can help clients to navigate the shifting landscapes.
The EM ex China universe has comparable liquidity to major markets
An increasing trend to allocate to Chinese equities is evident in the global equity fund flows’ data. Data from 2017 shows that there has been a steady rise of cumulative net inflows into China-A share equities. Conversely EM ex China experienced a steady decline; net outflows amounted to US$ 100bn as of end Dec 2021. As a result, EM ex China’s allocation in global mutual funds is well below the historic average.
Despite the outflows, EM ex China’s investible universe has exhibited comparable liquidity to other major markets. See Fig 5. Aside from the US, the average six monthly liquidity based on value traded in EM ex China for stocks with more than US$2 bn market cap is on par with the EU ex UK.
Fig 5: Liquidity conditions are comparable in EM ex China
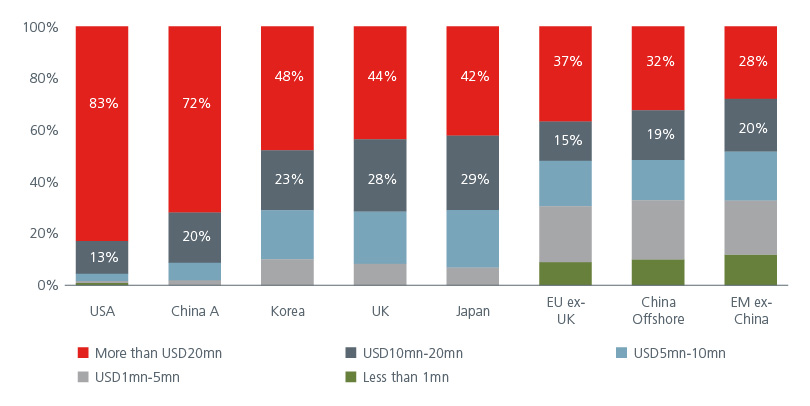
Source: Goldman Sachs Global Investment Research as of 31 January 2023. Liquidity as measured by the average daily volume turnover. Universe: Stocks with >USD2bn in market capitalisation
Why the next decade looks different to the last decade
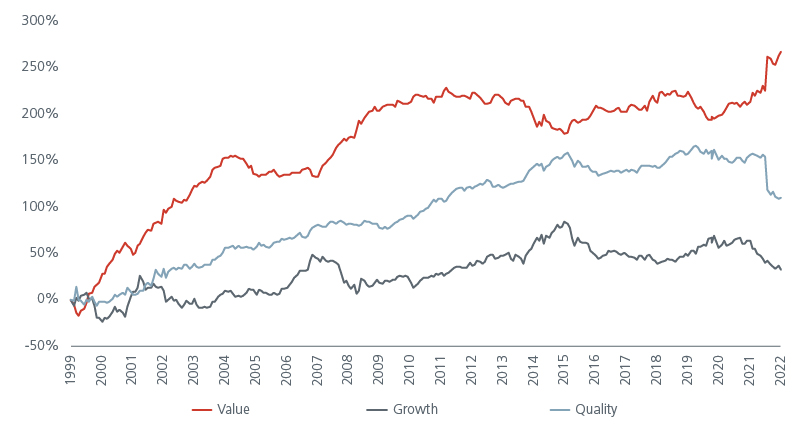
Post the 2009 Global Financial Crisis, the policy response from central banks and governments then focused on monetary policy and the banking system. There was little growth, no inflation, a bias away from capex and asset heavy models. This was the decade of the digital revolution; investors avoided value names and instead preferred high-quality stocks and those with short-term earnings potential. This trend was exacerbated in 2020 due to COVID-19 and created an extreme valuation dispersion within EM ex China between cheap stocks and expensive stocks.
But since late 2020, there has been a reversal in sentiment with value stocks strongly outperforming their growth sector peers. Despite the outperformance there is still plenty of room for value stocks to continue their run given that the current policy response is focused on investing in the real economy and supporting consumers. We are seeing substantial inflationary pressure along with rising rates which can help value stocks while hurting expensive growth and quality stocks.
We believe this is the decade of the decarbonisation revolution which will benefit equities related to real economy sectors such as many of those in the value space currently. A value-driven EM ex China strategy also tends to outperform in the long term. See Fig 6. Disciplined value investors thus have a unique opportunity to capture future outperformance in a diversified EM ex China universe.
Fig 6: Style performance of the EM ex China strategy
Source: Eastspring Investments as of 30 June 2022
Sources:
1 Eastspring Investments, 31 January 2023. MSCI Index.
Singapore by Eastspring Investments (Singapore) Limited (UEN: 199407631H)
Australia (for wholesale clients only) by Eastspring Investments (Singapore) Limited (UEN: 199407631H), which is incorporated in Singapore, is exempt from the requirement to hold an Australian financial services licence and is licensed and regulated by the Monetary Authority of Singapore under Singapore laws which differ from Australian laws
Hong Kong by Eastspring Investments (Hong Kong) Limited and has not been reviewed by the Securities and Futures Commission of Hong Kong.
Indonesia by PT Eastspring Investments Indonesia, an investment manager that is licensed, registered and supervised by the Indonesia Financial Services Authority (OJK).
Malaysia by Eastspring Investments Berhad (200001028634/ 531241-U) and Eastspring Al-Wara’ Investments Berhad (200901017585 / 860682-K).
Thailand by Eastspring Asset Management (Thailand) Co., Ltd.
United States of America (for institutional clients only) by Eastspring Investments (Singapore) Limited (UEN: 199407631H), which is incorporated in Singapore and is registered with the U.S Securities and Exchange Commission as a registered investment adviser.
European Economic Area (for professional clients only) and Switzerland (for qualified investors only) by Eastspring Investments (Luxembourg) S.A., 26, Boulevard Royal, 2449 Luxembourg, Grand-Duchy of Luxembourg, registered with the Registre de Commerce et des Sociétés (Luxembourg), Register No B 173737.
Chile (for institutional clients only) by Eastspring Investments (Singapore) Limited (UEN: 199407631H), which is incorporated in Singapore and is licensed and regulated by the Monetary Authority of Singapore under Singapore laws which differ from Chilean laws.
The afore-mentioned entities are hereinafter collectively referred to as Eastspring Investments.
The views and opinions contained herein are those of the author, and may not necessarily represent views expressed or reflected in other Eastspring Investments’ communications. This document is solely for information purposes and does not have any regard to the specific investment objective, financial situation and/or particular needs of any specific persons who may receive this document. This document is not intended as an offer, a solicitation of offer or a recommendation, to deal in shares of securities or any financial instruments. It may not be published, circulated, reproduced or distributed without the prior written consent of Eastspring Investments. Reliance upon information in this document is at the sole discretion of the reader. Please carefully study the related information and/or consult your own professional adviser before investing.
Investment involves risks. Past performance of and the predictions, projections, or forecasts on the economy, securities markets or the economic trends of the markets are not necessarily indicative of the future or likely performance of Eastspring Investments or any of the funds managed by Eastspring Investments.
Information herein is believed to be reliable at time of publication. Data from third party sources may have been used in the preparation of this material and Eastspring Investments has not independently verified, validated or audited such data. Where lawfully permitted, Eastspring Investments does not warrant its completeness or accuracy and is not responsible for error of facts or opinion nor shall be liable for damages arising out of any person’s reliance upon this information. Any opinion or estimate contained in this document may subject to change without notice.
Eastspring Investments companies (excluding joint venture companies) are ultimately wholly owned/indirect subsidiaries of Prudential plc of the United Kingdom. Eastspring Investments companies (including joint venture companies) and Prudential plc are not affiliated in any manner with Prudential Financial, Inc., a company whose principal place of business is in the United States of America or with the Prudential Assurance Company Limited, a subsidiary of M&G plc (a company incorporated in the United Kingdom).


