


Brian Ong
Portfolio Solutions Research,
Multi Asset Portfolio Solutions,
Eastspring Singapore
Nov 2025|5 min read
Executive Summary
- Beyond traditional portfolio construction techniques, there are ways we can enhance the portfolio construction process by providing clients with a richer analysis of potential portfolios.
- Complementing traditional portfolio construction techniques with a goals-based approach allows for a more meaningful portfolio design, especially when clients have goals that are intuitive but difficult to articulate.
- Advances in computing power now enable full-scale optimisation, offering greater flexibility and allowing us to move beyond mean-variance optimisation.
Strategic Asset Allocation is often viewed as a key driver of long-term portfolio performance. It serves as the cornerstone of long-term portfolio construction which typically begins with assumptions on the long-term (strategic) joint distribution of future asset returns. These are modelled as a multi-variate normal distribution, parameterised by μ and σ2 – expected return and risk respectively.
For most clients, expected return and risk serve as inputs in mean-variance optimisation1 to determine portfolio weights. Portfolios constructed through this method are mean-variance efficient; providing the highest expected return for a given level of expected risk. Repeating the optimisation creates an efficient frontier composed of multiple mean-variance efficient portfolios. Fig. 1.
Fig. 1. Portfolio efficient frontier with selected assets highlighted
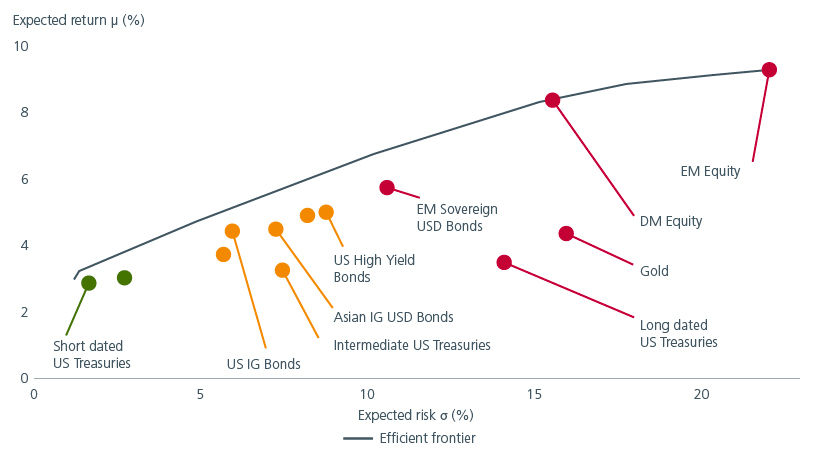
Source: Eastspring Investments. Thomson Reuters. September 2025. For visual simplicity, we have colour-coded the asset classes here according to their expected volatilities. Assets in green have low expected volatility (<5%), assets in amber have medium expected volatility (between 5% and 10%) and assets in red have high volatility (> 10%).
A goals-based approach to portfolio construction
While the earlier approach helps investors to assess the risk-return trade off more effectively, there may be instances where the proposed mean-variant portfolios may not fully incorporate the client’s desired goals. This is especially so when clients may have goals which they recognise intuitively but find it challenging to define explicitly. In these instances, we would employ an additional framework put forward by Golts and Jones2 which offers a goals-based approach to portfolio construction. The framework quantifies an asset’s exposure to four goals – Liquidity, Preservation, Income and Growth – based on the asset’s return skew. See Fig. 2.
Fig. 2. Asset classes - goals exposure

Source: Eastspring Investments. Thomson Reuters. September 2025. For visual simplicity, we have colour-coded the asset classes here according to their expected volatilities. Assets in green have low expected volatility (<5%), assets in amber have medium expected volatility (between 5% and 10%) and assets in red have high volatility (> 10%).
Each asset has varying exposure; ranging from 0% to 100%, to the different goals, totalling 100% across the four goals. For example, short-dated US Treasuries are almost fully exposed to the Liquidity goal, while US Floating Rate Asset Backed Securities (“ABS”) have equal exposures to the Income and Liquidity goals. This framework allows us to quickly compare asset characteristics across any investment universe.
Integrating real world constraints
By combining the two approaches, we can integrate asset goal exposures directly into a mean-variance optimisation. In this scenario, we build a constrained efficient frontier for a hypothetical client who requires a minimum exposure of 35% to both the Income and Growth goals. In Fig. 3, the dotted line represents the constrained efficient frontier which occupies a partial subspace of the original efficient frontier as indicated by the shaded grey area. Note that the constrained efficient frontier also sits below the original efficient frontier. These effects are expected, as imposing constraints on the portfolio construction process inherently narrows the range of potential portfolios.
Fig. 3. Efficient frontier with goal constraint
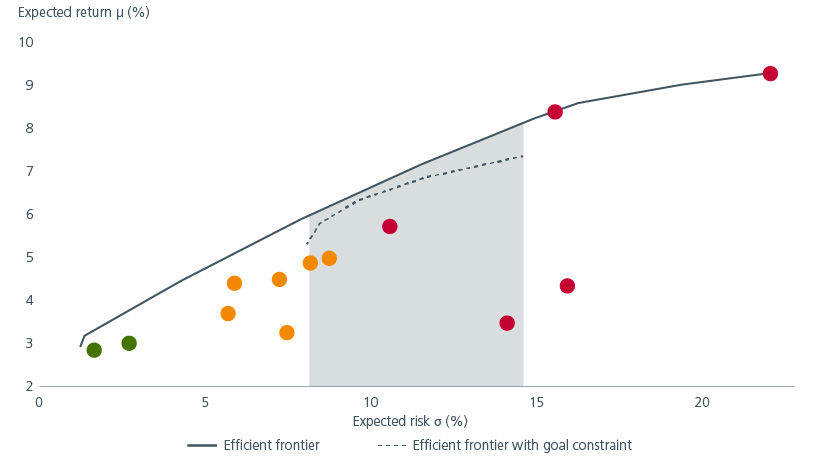
Source: Eastspring Investments. Thomson Reuters. September 2025. For visual simplicity, we have colour-coded the asset classes here according to their expected volatilities. Assets in green have low expected volatility (<5%), assets in amber have medium expected volatility (between 5% and 10%) and assets in red have high volatility (> 10%).
Consequently, the constraints shift the efficient portfolios away from the Growth and Preservation goals towards the Income goal. See Fig. 4. The next step would then be to determine the most suitable portfolio for our hypothetical client.
Fig. 4. Portfolio goal exposures
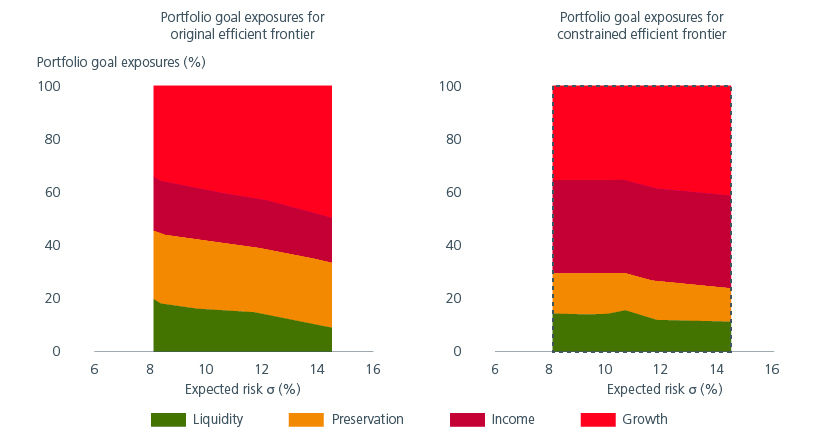
Source: Eastspring Investments. Thomson Reuters, September 2025.
Alternatives to mean-variance optimisation
Mean-variance optimisation, which was developed in 1952, remains widely used in portfolio construction. Its popularity stems largely from its analytical objective function, which is based on the assumptions that asset returns are normally distributed, and investors have exponential utility functions. However, modern computing power now increasingly allows us to perform full-scale optimisation3, which provides greater flexibility and a move away from such assumptions.
One straightforward approach to full-scale optimisation, which does not rely on advanced algorithms, involves using a brute-force search. In this approach, we first generate candidate portfolios and then filter out those that do not meet client constraints. We then evaluate each remaining portfolio according to the client's requirements. While this approach is computationally intensive and less efficient, it preserves data about sub-optimal portfolios, which can assist us in a more complete analysis of potential client portfolios.
To illustrate, we revisit our hypothetical client. In addition to the earlier goal constraints, the client now also desires the portfolio to deliver an expected return of above 5% p.a. and to maintain risk below 10% p.a.
The horizontal and vertical purple lines in Fig. 5 indicate the client’s new secondary constraints on expected return and risk. The purple area, bounded by these lines and the dotted (constrained) efficient frontier, represents the new subspace of candidate portfolios. The blue points represent different candidate portfolios that meet the client’s requirements for return, risk and goal exposures.
Fig. 5. Efficient frontier with return and risk constraints
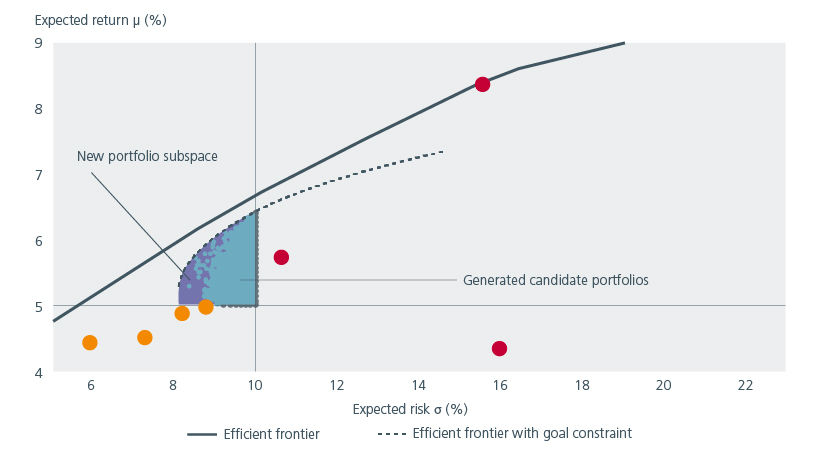
Source: Eastspring Investments. Thomson Reuters. September 2025. For visual simplicity, we have colour-coded the asset classes here according to their expected volatilities. Assets in amber have medium expected volatility (between 5% and 10%) and assets in red have high volatility (> 10%).
We subsequently assess the candidate portfolios using additional metrics to evaluate trade-offs against client objectives. This methodology is particularly valuable when client goals are ambiguous or conflicting. In such cases, brute-force optimisation serves as a useful starting point to identify portfolios that are most closely aligned to the client’s requirements.
A limitation, however, of brute-force optimisation is the exponential growth in computational demands as further constraints are introduced or as the universe of potential assets expands. This makes it impractical to generate enough candidate portfolios to exhaustively cover the entire portfolio subspace.
Building better portfolios
While we recognise the strength of traditional portfolio construction techniques, there are ways where we can enhance the portfolio construction and selection process by providing clients with a richer analysis of potential portfolios that are designed to best meet their needs. For example, complementing traditional portfolio construction techniques with a goals-based approach allows for a more meaningful portfolio design, especially when clients may have goals that are intuitive but difficult to articulate. At the same time, advances in computing power now enable full-scale optimisation, offering greater flexibility and allowing us to move beyond mean-variance optimisation. Together these enhancements empower us to build portfolios that are analytically sound and more closely aligned with the nuanced needs of investors.
Interesting reads


Sources:
1 Markowitz H., 1952, Portfolio Selection, The Journal of Finance Vol. 7.
2 Golts M. & Jones G. C., 2025, Goal Parity, The Journal of Investing Vol. 34.
3 Adler T. & Kritzman M., 2006, Mean-Variance versus Full-Scale Optimisation: In and Out of Sample, Journal of Asset Management Vol. 7.
This document is produced by Eastspring Investments (Singapore) Limited and issued in:
Singapore by Eastspring Investments (Singapore) Limited (UEN: 199407631H)
Australia (for wholesale clients only) by Eastspring Investments (Singapore) Limited (UEN: 199407631H), which is incorporated in Singapore, is exempt from the requirement to hold an Australian financial services licence and is licensed and regulated by the Monetary Authority of Singapore under Singapore laws which differ from Australian laws
Hong Kong by Eastspring Investments (Hong Kong) Limited and has not been reviewed by the Securities and Futures Commission of Hong Kong.
Indonesia by PT Eastspring Investments Indonesia, an investment manager that is licensed, registered and supervised by the Indonesia Financial Services Authority (OJK).
Malaysia by Eastspring Investments Berhad (200001028634/ 531241-U) and Eastspring Al-Wara’ Investments Berhad (200901017585 / 860682-K) and has not been reviewed by Securities Commission of Malaysia.
Thailand by Eastspring Asset Management (Thailand) Co., Ltd.
United States of America (for institutional clients only) by Eastspring Investments (Singapore) Limited (UEN: 199407631H), which is incorporated in Singapore and is registered with the U.S Securities and Exchange Commission as a registered investment adviser.
European Economic Area (for professional clients only) and Switzerland (for qualified investors only) by Eastspring Investments (Luxembourg) S.A., 26, Boulevard Royal, 2449 Luxembourg, Grand-Duchy of Luxembourg, registered with the Registre de Commerce et des Sociétés (Luxembourg), Register No B 173737.
Chile (for institutional clients only) by Eastspring Investments (Singapore) Limited (UEN: 199407631H), which is incorporated in Singapore and is licensed and regulated by the Monetary Authority of Singapore under Singapore laws which differ from Chilean laws.
The afore-mentioned entities are hereinafter collectively referred to as Eastspring Investments.
The views and opinions contained herein are those of the author, and may not necessarily represent views expressed or reflected in other Eastspring Investments’ communications. This document is solely for information purposes and does not have any regard to the specific investment objective, financial situation and/or particular needs of any specific persons who may receive this document. This document is not intended as an offer, a solicitation of offer or a recommendation, to deal in shares of securities or any financial instruments. It may not be published, circulated, reproduced or distributed without the prior written consent of Eastspring Investments. Reliance upon information in this document is at the sole discretion of the reader. Please carefully study the related information and/or consult your own professional adviser before investing.
Investment involves risks. Past performance of and the predictions, projections, or forecasts on the economy, securities markets or the economic trends of the markets are not necessarily indicative of the future or likely performance of Eastspring Investments or any of the funds managed by Eastspring Investments.
Information herein is believed to be reliable at time of publication. Data from third party sources may have been used in the preparation of this material and Eastspring Investments has not independently verified, validated or audited such data. Where lawfully permitted, Eastspring Investments does not warrant its completeness or accuracy and is not responsible for error of facts or opinion nor shall be liable for damages arising out of any person’s reliance upon this information. Any opinion or estimate contained in this document may subject to change without notice.
Eastspring Investments companies (excluding joint venture companies) are ultimately wholly owned/indirect subsidiaries of Prudential plc of the United Kingdom. Eastspring Investments companies (including joint venture companies) and Prudential plc are not affiliated in any manner with Prudential Financial, Inc., a company whose principal place of business is in the United States of America or with the Prudential Assurance Company Limited, a subsidiary of M&G plc (a company incorporated in the United Kingdom).