


Executive Summary
- Asian governments are encouraging listed companies to boost shareholder returns and improve market value, aiming to benefit domestic retail investors and savings base.
- Precedence in Japan and the alignment of interests imply that recent government actions to improve corporate governance in China, Korea and India could sustain in the medium to long term. Potential outcomes include higher dividends and share buybacks, improving return on equity, and lower share price volatility.
- Companies seeing change are likely to be found amongst the state-owned enterprises, as well as the old economy and lower growth sectors. Such companies are typically unloved and contrarian, and are an attractive investment opportunity in our view.
Asian equities have lagged their global peers over the last decade on the back of poor earnings per share growth, rising risk premium from geopolitics and regulation and more recently, China’s lacklustre economy. However, a government push for improved governance among listed companies may be gaining momentum across the region which can potentially drive improved shareholder returns and help realise the inherent value in many laggard parts of the Asian equity markets. After all, Asian equity valuations are very attractive – at the current 1.5x trailing price-to-book ratio, Asia trades at a 50% discount to MSCI AC World1. Fig. 1.
Fig. 1. MSCI Asia ex Japan relative to MSCI AC World (Trailing price-to-book ratio)
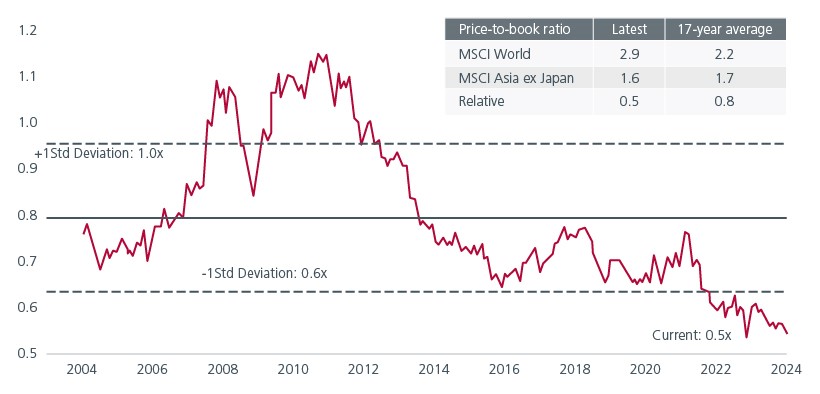
Source: Eastspring Investments, Refinitiv Datastream, MSCI, as at 31 January 2024. Please note that there are limitations to the use of such indices (index) as proxies (a proxy) for the past performance in the respective asset classes/sector. The historical performance or forecast presented is not indicative of and should not be construed as being indicative of or otherwise used as a proxy for the future or likely performance of the Strategy.
More skin in the game
The call for better corporate governance and SOE reforms is not new in Asia. However, the rising level of retail participation in the region’s stock markets post the COVID pandemic suggests that governments’ consideration for their stock markets’ performance and valuations is likely to be more persistent. Asia Pacific’s retail participation in the equity markets is the highest relative to the rest of the world. Fig. 2 and 3.
Fig. 2. Retail participation in equity markets
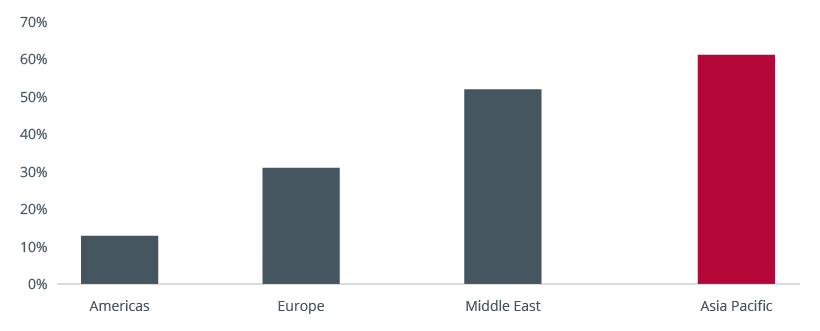
Source: World Federation of Exchanges. Retail trading: an analysis of global trends and drivers. Pedro Gurrola-Perez, Kaitao Lin, Bill Speth. September 2022.
Fig. 3. Retail investors are major participants in Asian equity markets (YTD average, % of total cash turnover)
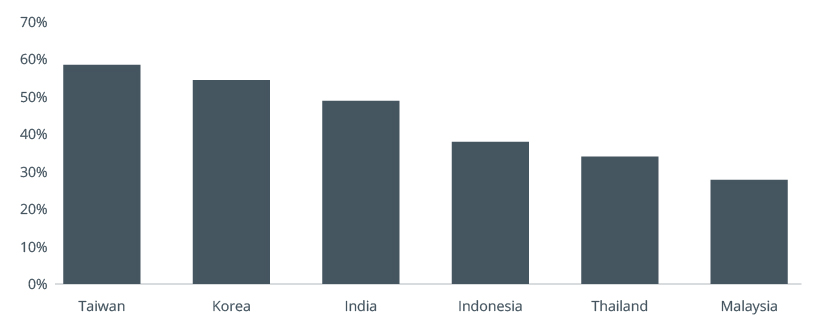
Source: : Bloomberg Finance L.P. JP Morgan Equity Macro Research. February 2024.
Several Asian governments are large equity owners in their domestic markets (direct and through public pensions), and are therefore aligned with retail investors on having an increased flow of dividends from the listed universe.
South Korean president Yoon himself took aim at the Korea discount that had been plaguing the country’s stock market by calling for bold tax reforms and better protection of minority shareholders. He highlighted that unlike in the past, retail stock ownership is much higher. The number of South Korean retail investors has more than doubled since the coronavirus pandemic2. Since President Yoon’s inauguration in May 2022, the government has been improving capital market practices including the easing of foreign currency market regulations and reducing capital gains taxes for equities.
In India, the number of demateralised accounts, an account which helps investors hold shares and securities in a digital format, more than tripled from 4.09 crore in March 2020 to 13,23 crore as on October 2023. Meanwhile, the share of retail investors' direct holdings in Indian companies listed on the National Stock Exchange surged to an all-time high of 7.62% as of September 20233.
In Japan, the government recently revamped its NISA (Nippon Individual Savings Account) programme. NISA accounts were originally launched in 2014 to encourage more Japanese households to invest. In its latest refresh, the government doubled the annual investment limit for growth accounts to 2.4 million yen and made them permanently tax-free. Meanwhile, according to the China Securities Regulatory Commission (CSRC) Chairman, retail investors accounted for about 60% of the total A-share turnover in late 2022 in China.
“Valuing up” in Asia
One does not need to look too far to see what successful corporate reforms can achieve. Japan’s corporate reforms have been in progress for over a decade, when then Prime Minister Abe championed corporate governance reforms as part of his economic strategy in 2012. Since then, dividends and share buybacks have increased in Japan. Fig. 4. In early 2023, the Tokyo Stock Exchange (TSE) requested listed companies, particularly those trading below 1x price-to-book-value, to disclose their plans for improvement, adding pressure especially on management teams of poorly performing corporates. While easing deflationary pressures, a weak yen and an improving economy have helped to boost investor sentiment towards Japanese equities, the policymakers’ actions were a game changer. Various Asian countries are coming up with their own versions of corporate reform programmes.
Fig. 4. Dividends and share buybacks by Japanese companies
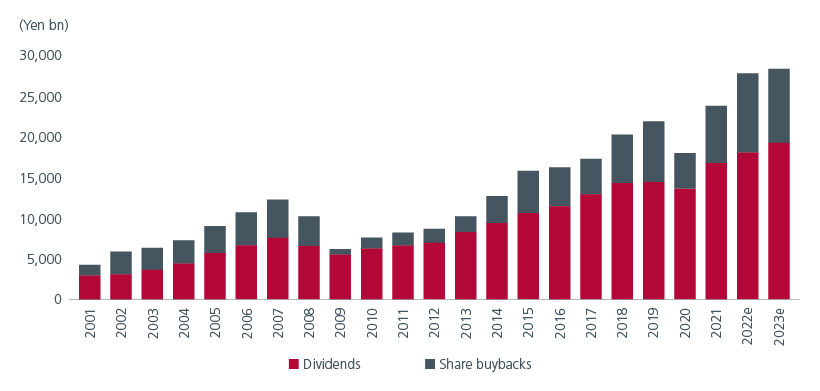
Source: Nomura, as at 31 December 2023. FY23 is Nomura estimate. Based on company's data and Toyokeizai and Nomura estimate data; for FY21, share buybacks are actual executed amount and dividends are Nomura estimates.
South Korea
Despite being Asia’s fourth largest economy, South Korean companies have historically traded at lower valuations than regional and global peers. At the point of writing, the price-to-book ratio of MSCI Korea is 1.1x4 compared to 1.5x for MSCI Asia ex Japan. This phenomenon known as the “Korea discount” is due to multiple factors including low dividend payouts, and the dominance of chaebols, large family-run conglomerates that are perceived to have poorer corporate governance. Fig. 5 and 6 show that even though Korea has a large share of net cash companies, its dividend payout ratio is below that of Japan, the US and Europe.
Fig. 5. Share of net cash companies
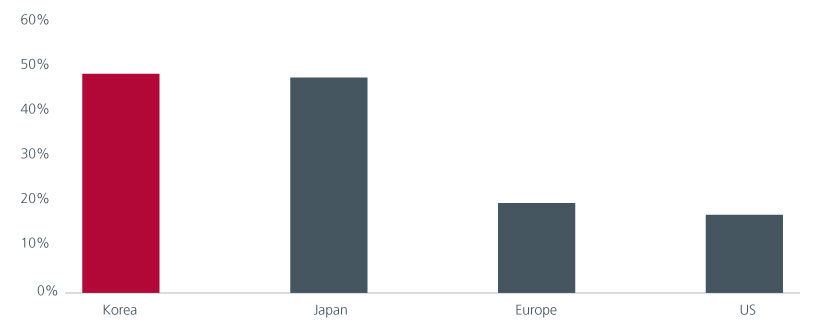
Source: Bloomberg. J.P. Morgan Equity Research. February 2024.
Fig. 6. Median payout ratio
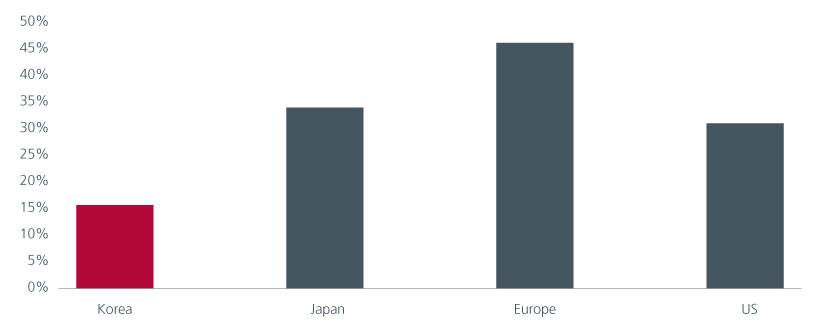
In February, Korea’s Financial Services Commission announced details of a programme aimed at narrowing the Korea discount. The three pillars of the programme consist of a guideline to incentivise companies to come up with measures to drive up their stock prices voluntarily; the creation of a new benchmark index (“Korea Value-up Index”) that will be made up of companies with desirable performances in enhancing corporate value; and the setting up of a government support system to facilitate the programme.
India
In India, the discount is largely focused within its Public Sector Undertakings (PSU) or State-Owned Enterprises (SOEs). At the point of writing, the PSU Index is trading at a 40% discount to Nifty on a price to earnings ratio versus its pre-FY18 discount of around 30%5. Fig. 7. Historically, the discount has existed due to poorer return on equity, perception of weaker governance and equity sale by the government. Recently this has changed with limited stake sales by the government and focus on value maximisation. The government has emphasised that prioritising the maximisation of PSU value takes precedence over divestment for funding India's fiscal needs. Meanwhile, stock performance now counts towards the assessment of PSU top management6. This value maximisation in India may come in the form of tighter internal evaluation of capital expenditure, market driven decision-making and higher returns to shareholders (including to the government as the largest shareholder).
Fig. 7. BSE PSU PE Premium/(Discount) over Nifty
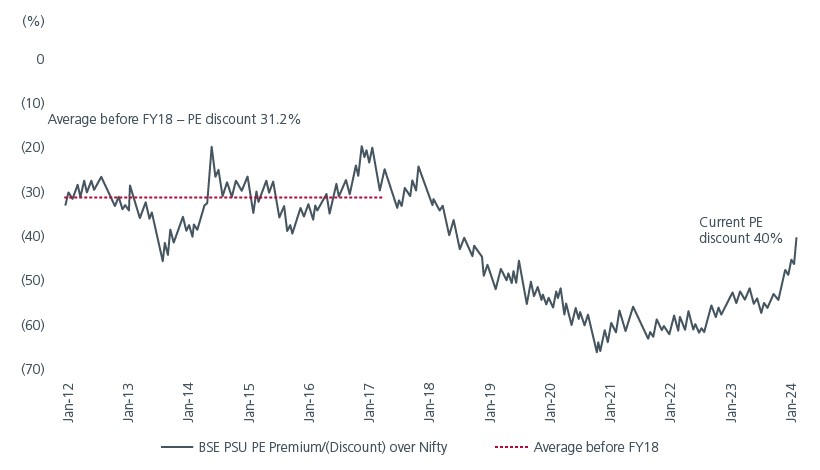
Source: Bloomberg. Jefferies. February 2024.
China
In 2022, China’s CSRC Chairman called for "exploring a valuation system with Chinese characteristics". This was followed by an announcement from the Shanghai Stock Exchange of a 3-year action plan to "promote the valuation of central SOEs to return to appropriate levels". This year, China’s State-owned Assets Supervision and Administration Commission of the State Council (SASAC) talked about making market value management a Key Performance Indicator for listed central SOEs and a policy priority. We have seen China’s central SOEs significantly increase their dividends in 2021 – 2022. Fig. 8. Currently, China’s SOEs trade at half the valuations of non-SOEs in both price to earnings and price-to-book terms. Investor perception that the SOEs put national interests ahead of shareholders coupled with poor operating efficiency have also weighed on valuations.
Fig. 8. Aggregate dividend paid by A-share companies (USD bn)
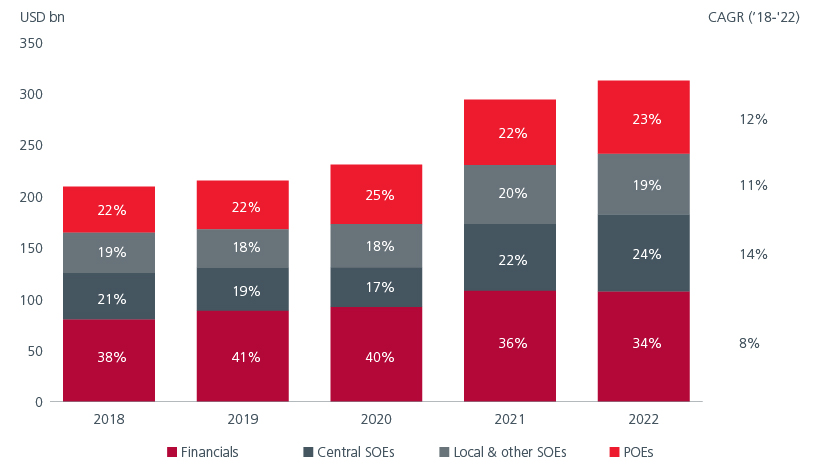
Source: Bloomberg. BofA Global Research. March 2024.
Likely beneficiaries
We believe that dividend payout ratios would be the first to be impacted from the move to improve corporate governance and maximise corporate value. Asian balance sheets are among the least geared globally and Asian companies can afford to pay out higher dividends without compromising on growth capital investment. China Central SOEs have followed through on the government’s push with the dividend payout ratio rising from <45% in 2018-20, to 50-55% in 2021-227 . Stock buybacks and cancellations, where Asia has lagged the US over the last 10 years, is another way to implement the government’s push for value maximisation. A bigger focus on cash returns and thereby cashflows improves return on equity, as balance sheets get optimised and low-returns capital expenditure gets de-prioritised. We have repeatedly seen lazy balance sheets leading to poor capex decisions and deeper industry downturns. Higher cash returns and return on equity also reduce share price volatility in our view.
SOEs are likely to be the first beneficiaries of the government’s push to increase market value. While SOEs will remain a part of the government’s policy toolkit, having a higher cash commitment to shareholders reduces the national service risk on cashflows to some extent. Another set of beneficiaries are old economy companies with complex shareholding structures such as crossholdings and which consequently suffer from holding company discounts. A third group of beneficiaries are lower growth companies with sub-optimal debt structures; these can include the telecommunications, commodity and industrial companies.
A common characteristic of the three groups of companies mentioned above is the market’s unfavourable perception given their lower growth trajectory and poorer quality. As a result, positioning is lighter, there is less research conducted on these companies over the last few years, and they are mispriced. At Eastspring, our value philosophy is premised on the observation that human emotions and behavioural biases distort investment decision making. This leads investors to focus on the recent past, extrapolate into the near future, and thus overpay for the promise of growth and perception of quality. We like the contrarian nature of the three groups of companies mentioned above and find them offering attractive investment opportunities for our investors.
Interesting reads


Sources:
1 Source: Refinitiv Datastream, MSCI as at 41 January 2024.
2 https://www.koreatimes.co.kr/www/biz/2024/02/602_363158.html
3 https://economictimes.indiatimes.com/markets/stocks/news/retail-play-in-listed-companies-hits-a-new-high/articleshow/105107378.cms?utm_source=contentofinterest&utm_medium=text&utm_campaign=cppst
4 Refinitiv Datastream. End February 2024.
5 Jefferies. PSU (SOE) rerating has more legs. February 2024.
6 Refinitiv Datastream. End February 2024.
7 BofA Global Research. March 2024.
Singapore by Eastspring Investments (Singapore) Limited (UEN: 199407631H)
Australia (for wholesale clients only) by Eastspring Investments (Singapore) Limited (UEN: 199407631H), which is incorporated in Singapore, is exempt from the requirement to hold an Australian financial services licence and is licensed and regulated by the Monetary Authority of Singapore under Singapore laws which differ from Australian laws
Hong Kong by Eastspring Investments (Hong Kong) Limited and has not been reviewed by the Securities and Futures Commission of Hong Kong.
Indonesia by PT Eastspring Investments Indonesia, an investment manager that is licensed, registered and supervised by the Indonesia Financial Services Authority (OJK).
Malaysia by Eastspring Investments Berhad (200001028634/ 531241-U) and Eastspring Al-Wara’ Investments Berhad (200901017585 / 860682-K) and has not been reviewed by Securities Commission of Malaysia.
Thailand by Eastspring Asset Management (Thailand) Co., Ltd.
United States of America (for institutional clients only) by Eastspring Investments (Singapore) Limited (UEN: 199407631H), which is incorporated in Singapore and is registered with the U.S Securities and Exchange Commission as a registered investment adviser.
European Economic Area (for professional clients only) and Switzerland (for qualified investors only) by Eastspring Investments (Luxembourg) S.A., 26, Boulevard Royal, 2449 Luxembourg, Grand-Duchy of Luxembourg, registered with the Registre de Commerce et des Sociétés (Luxembourg), Register No B 173737.
Chile (for institutional clients only) by Eastspring Investments (Singapore) Limited (UEN: 199407631H), which is incorporated in Singapore and is licensed and regulated by the Monetary Authority of Singapore under Singapore laws which differ from Chilean laws.
The afore-mentioned entities are hereinafter collectively referred to as Eastspring Investments.
The views and opinions contained herein are those of the author, and may not necessarily represent views expressed or reflected in other Eastspring Investments’ communications. This document is solely for information purposes and does not have any regard to the specific investment objective, financial situation and/or particular needs of any specific persons who may receive this document. This document is not intended as an offer, a solicitation of offer or a recommendation, to deal in shares of securities or any financial instruments. It may not be published, circulated, reproduced or distributed without the prior written consent of Eastspring Investments. Reliance upon information in this document is at the sole discretion of the reader. Please carefully study the related information and/or consult your own professional adviser before investing.
Investment involves risks. Past performance of and the predictions, projections, or forecasts on the economy, securities markets or the economic trends of the markets are not necessarily indicative of the future or likely performance of Eastspring Investments or any of the funds managed by Eastspring Investments.
Information herein is believed to be reliable at time of publication. Data from third party sources may have been used in the preparation of this material and Eastspring Investments has not independently verified, validated or audited such data. Where lawfully permitted, Eastspring Investments does not warrant its completeness or accuracy and is not responsible for error of facts or opinion nor shall be liable for damages arising out of any person’s reliance upon this information. Any opinion or estimate contained in this document may subject to change without notice.
Eastspring Investments companies (excluding joint venture companies) are ultimately wholly owned/indirect subsidiaries of Prudential plc of the United Kingdom. Eastspring Investments companies (including joint venture companies) and Prudential plc are not affiliated in any manner with Prudential Financial, Inc., a company whose principal place of business is in the United States of America or with the Prudential Assurance Company Limited, a subsidiary of M&G plc (a company incorporated in the United Kingdom).