


Executive Summary
- For active fundamental strategies, evaluating liquidity aspects during position sizing and portfolio construction helps manage risk and subsequently smoothen execution.
- Scenario analysis allows our portfolio managers to evaluate constraints and trading strategies, stress test portfolios and weigh trade-offs between speed, cost and portfolio strategy.
- In a market environment where liquidity can shift quickly and unpredictably, a structured decision approach is essential for maintaining consistency and driving optimal investment outcomes.
In discussions on fundamental investment processes, topics such as stock selection and drivers of performance and risk tend to take center stage. Under the hood, however, the consideration of liquidity and management of fund flow is equally important. When investment opportunities are found in less liquid parts of the market, or when there is material fund inflow or outflow, planning contributes towards better portfolio outcomes.
In collaboration with our active equity teams, we developed a set of proprietary analytics to add rigour to such discussions. These analytics are designed to provide data to help on position sizing, align timelines with key stakeholders with respect to large flows, and provide a data-informed reference for decision making in the event of uncertain market conditions.
Considering liquidity management when building a portfolio
A thorough understanding of company fundamentals - such as business models, management quality, and competitive positioning - builds towards the decision on which stocks to buy or sell. A crucial next step is the decision on position sizing, where liquidity risk is one important consideration. Being aware of how to buy/scale up or exit/scale down a position is critical as execution challenges can arise at both the individual position level and across the broader portfolio.
At the position level, the ability to increase or reduce the desired number of shares is affected by a stock’s liquidity and the varying profiles of short-term vs. long-term investors. Our toolkit provides data points such as the number of trading days needed to exit, fund ownership ratio at the stock-level, and tracks these metrics over time at the aggregated portfolio-level, which helps to manage liquidity risk. (Fig. 1)
Fig. 1. Dashboards for tracking portfolio liquidity profile
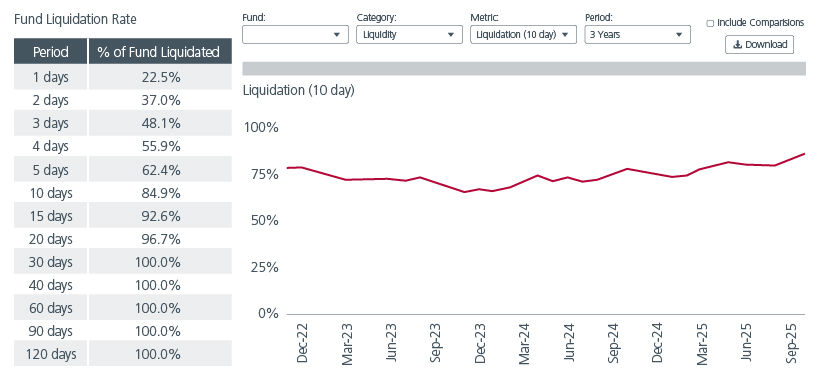
Source: Eastspring Investments. Analysis date: 30-Sep-2025. Sample dashboards tracking the liquidity profile of a Japan Equity strategy.
These analytics are built on top of Transaction Cost Analysis (TCA) data sets, allowing us to use both current and historical trends for more precise stock-specific liquidity assumptions. This is important as stock liquidity profiles can vary significantly across countries and sectors. Differences in liquidity profiles are also likely to be magnified during periods of market stress.
We illustrate this in Fig. 2. by simulating the same trade value into a market capitalisation-weighted ASEAN and Asia ex Japan index. The result informs us of two different trajectories (i.e. the speed and acceleration achieved in completing the trade).
Fig. 2. Comparing the pace of execution flows in different equity markets
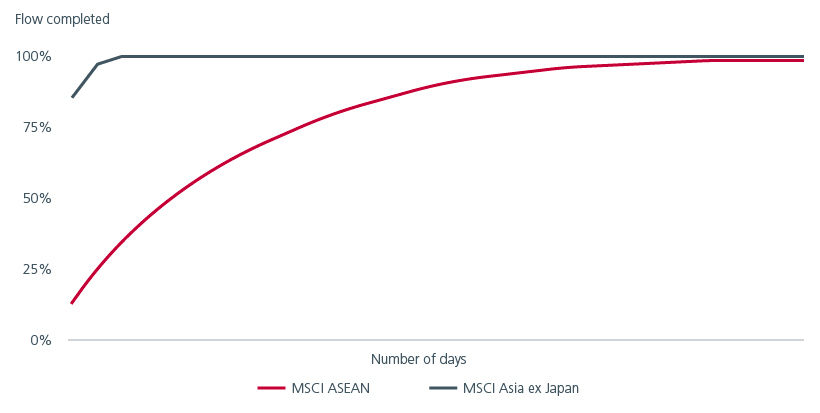
Source: Eastspring Investments. Analysis date: 30-Sep-2025. Simulation of an investment inflow into hypothetical ‘market portfolios’ as represented by the MSCI ASEAN and MSCI Asia ex Japan indexes.
At the portfolio level, execution challenges can result from portfolio strategy and portfolio construction intents. For example, if there is a large flow to execute, portfolio size can impact the type of stocks that a portfolio holds due to liquidity reasons. A larger portfolio would find it challenging to continue holding smaller and less liquid stocks as the portfolio grows. At the same time, trades can be used to reshape portfolio style exposures, reduce concentration, rebalance regional allocations, or trim a stock that has exceeded or is approaching its forecasted intrinsic value. Portfolio analytics can help us evaluate how portfolio characteristics evolve and ensure that they are aligned with the target portfolio strategy.
Some examples of decisions which would benefit from data and discussion prior to trading include:
- Deciding whether to prioritise speed or to maintain the portfolio’s risk profile during the trading window. While a faster pace of execution may be justified by market conditions or alpha decay, a slower approach may preserve exposures and potentially minimise trading costs by avoiding unusually large stock trading volumes.
- Increasing execution flexibility by leveraging existing cash. This can reduce the urgency for sell trades and/or enable top ups of shortfalls for buy trades if sale proceeds are delayed or insufficient. For dividend paying strategies, our portfolio managers can also choose to ringfence a portion of cash if they are aware that a material buy trade is going to coincide with an upcoming payout.
- Identifying trades in advance that may require differentiated execution strategies (e.g. block trades), which is especially relevant for trades that involve illiquid or volatile stocks. In some of these instances, to minimise market impact, our portfolio manager can use the liquidity analytics collected during pre-trade planning to negotiate for a longer execution window with the client.
Reviewing and managing liquidity through scenario analysis
Running portfolios through hypothetical scenarios helps to surface potential issues which would benefit from further debate. A key building block of scenario analysis is the choice of execution approach. This allows us to evaluate how the portfolio changes through the trading horizon.
Some examples of execution approaches are:
- Fire-sale: Aggressive liquidation which is typically used during redemptions or market exits. This approach is usually considered only if rapid execution is required. The final portfolio shape may look very different from the one prior to the execution.
- Pro-rata: Even distribution across time or volume which minimises market impact. This approach ensures that the portfolio retains its overall shape throughout the execution period. It is likely to be used when the execution timeframe is longer, or if the market environment is highly uncertain and the manager does not want the temporary distortion in the portfolio to be a drag on performance.
- Hybrid: Balances urgency and liquidity sensitivity while adapting to real-time market conditions. This approach blends the strength of the earlier two approaches by prioritising the more liquid stocks and then gradually transitioning into (or out of) less liquid positions. This ensures that the portfolio ends up with its target portfolio shape and is likely to be the most realistic approach for most investment strategies.
Fig. 3. shows the time taken for a trade flow to be completed using the three different execution approaches. As expected, the ‘Firesale’ approach prioritises speed over the need to have a targeted portfolio shape at the end of execution period. The ‘Pro-rata’ and ‘Hybrid’ approaches take the same amount of time to complete the trade flow although the latter allows for a quicker deployment at the start. The differences between the ‘Pro-rata’ and ‘Hybrid’ approaches are only in the sequencing and volume of stocks to be traded across the execution horizon.
Fig. 3. Flow projection of different execution approaches
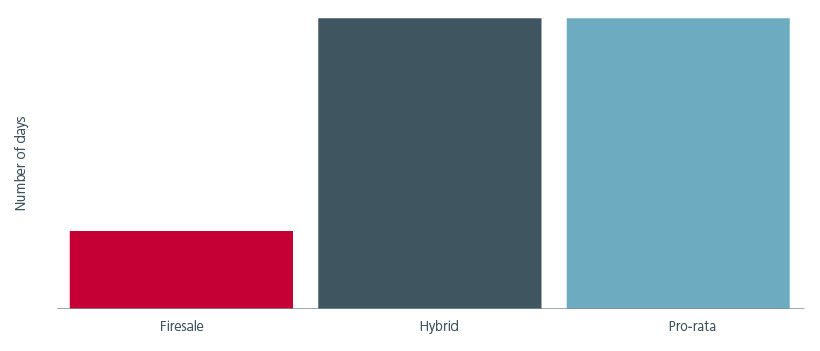
Source: Eastspring Investments. Analysis date: 30-Sep-2025. Trading simulation is based on a hypothetical portfolio investing in a large and liquid Asian market.
As mentioned earlier, it will take longer to exit or build a position in less liquid stocks. If speed is a priority, and these less liquid stocks do not play a critical role in the portfolio, we could consider freezing these positions and buying or selling more of the other stocks. By simulating the trajectory differences, our portfolio managers can quantitatively weigh the benefits of not trading positions which are less liquid. See Fig. 4.
Fig. 4. Portfolio flow simulation

Source: Eastspring Investments. Analysis date: 30-Sep-2025. Note: In the ‘Illiquid Positions Not Traded’ simulation, we execute the same required level of flow without securities which have poor liquidity profiles. Trading simulation is based on a hypothetical portfolio investing in a large and liquid Asian market.
However, in the event where there is a large and urgent outflow, where even the sale of less liquid stocks may be required to raise cash, then the participation1 can be nudged higher but this may result in greater market impact. Nevertheless, the portfolio manager may prefer this approach to avoid skewing the portfolio towards less liquid and/or small capitalisation stocks.
Fig 5. shows that we can reduce the execution time by increasing the level of trade participation. This approach, however, should be accompanied by a thorough cost-benefit analysis, as increased execution speed might be offset by higher trading costs.
Fig. 5. Analysing the result of larger trade participation if speed is required

Source: Eastspring Investments. Analysis date: 30-Sep-2025. Participation refers to the level of traded flow relative to the average traded value per security, typically measured over a period of time. For example, if a security typically trades USD1 million a day, a 20% participation suggests trading up to USD200k. Trading simulation is based on a hypothetical portfolio investing in a large and liquid Asian market.
The resulting analytics from the portfolio simulation can be used to engage the client around reasonable timeframes and flow sizes. In the above scenario, a win-win solution could be to break the larger outflow into several more manageable tranches.
We find that stress-testing is a helpful tool for discussions around strategy capacity, and liquidity management particularly for strategies with a tilt towards Small-and-Mid (SMID) capitalization stocks. The heatmap in Fig. 6. Illustrates the results of such a stress test. We simulate a significant fund flow of up to USD 1 billion into a diversified Asia ex Japan index to approximate what a typical trading horizon would look like.
The questions we ask ourselves next are typically:
- Given the current stock selection and position-sizing, how large could this strategy be based on reasonable trading days?
- Are there any pockets of illiquidity in the portfolio which impact overall liquidity?
- If we modify position sizing to manage liquidity, how would the risk factor profile change?
Fig. 6. Using a large trade flow to evaluate portfolio liquidity thresholds
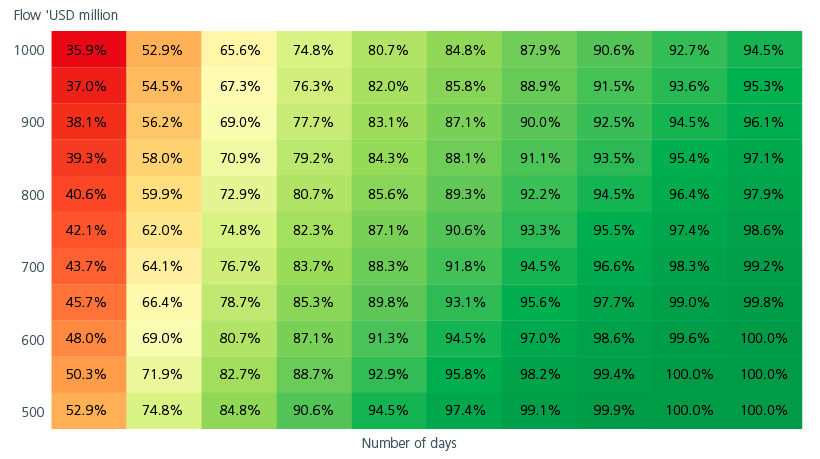
Source: Eastspring Investments. Analysis date: 30-Sep-2025. The values within the cells refer to the percentage of completion to the total trade flow required. Trading simulation is based on a hypothetical portfolio investing in a large and liquid Asian market.
Powering active strategies with liquidity analytics
Liquidity analytics is key in supporting decision-making throughout the investment process, from idea generation (position-sizing) to ongoing portfolio management (fund flow planning). These tools provide structure and equip our portfolio managers with data to debate and decide more confidently. By anticipating liquidity constraints across the region and structuring trades through scenario analysis, these frameworks instill discipline and enhance transparency throughout the investment process.
While such tools cannot fully eliminate liquidity risks, they help to highlight areas of concern and make them more manageable. Meanwhile, a scenario approach complements the investment process of active fundamental strategies as it allows the portfolio managers to test a range of assumptions and investigate the range of possible outcomes on a stock-by-stock basis.
In a market environment where liquidity can shift quickly and unpredictably, a structured decision approach is essential for maintaining consistency and driving optimal investment outcomes.
Interesting reads


Sources:
1 Participation refers to the level of traded flow relative to the average traded value per security, typically measured over a period of time. For example, if a security trades USD1 million a day, a 20% participation suggests trading up to USD200k.
Singapore by Eastspring Investments (Singapore) Limited (UEN: 199407631H)
Australia (for wholesale clients only) by Eastspring Investments (Singapore) Limited (UEN: 199407631H), which is incorporated in Singapore, is exempt from the requirement to hold an Australian financial services licence and is licensed and regulated by the Monetary Authority of Singapore under Singapore laws which differ from Australian laws
Hong Kong by Eastspring Investments (Hong Kong) Limited and has not been reviewed by the Securities and Futures Commission of Hong Kong.
Indonesia by PT Eastspring Investments Indonesia, an investment manager that is licensed, registered and supervised by the Indonesia Financial Services Authority (OJK).
Malaysia by Eastspring Investments Berhad (200001028634/ 531241-U) and Eastspring Al-Wara’ Investments Berhad (200901017585 / 860682-K) and has not been reviewed by Securities Commission of Malaysia.
Thailand by Eastspring Asset Management (Thailand) Co., Ltd.
United States of America (for institutional clients only) by Eastspring Investments (Singapore) Limited (UEN: 199407631H), which is incorporated in Singapore and is registered with the U.S Securities and Exchange Commission as a registered investment adviser.
European Economic Area (for professional clients only) and Switzerland (for qualified investors only) by Eastspring Investments (Luxembourg) S.A., 26, Boulevard Royal, 2449 Luxembourg, Grand-Duchy of Luxembourg, registered with the Registre de Commerce et des Sociétés (Luxembourg), Register No B 173737.
Chile (for institutional clients only) by Eastspring Investments (Singapore) Limited (UEN: 199407631H), which is incorporated in Singapore and is licensed and regulated by the Monetary Authority of Singapore under Singapore laws which differ from Chilean laws.
The afore-mentioned entities are hereinafter collectively referred to as Eastspring Investments.
The views and opinions contained herein are those of the author, and may not necessarily represent views expressed or reflected in other Eastspring Investments’ communications. This document is solely for information purposes and does not have any regard to the specific investment objective, financial situation and/or particular needs of any specific persons who may receive this document. This document is not intended as an offer, a solicitation of offer or a recommendation, to deal in shares of securities or any financial instruments. It may not be published, circulated, reproduced or distributed without the prior written consent of Eastspring Investments. Reliance upon information in this document is at the sole discretion of the reader. Please carefully study the related information and/or consult your own professional adviser before investing.
Investment involves risks. Past performance of and the predictions, projections, or forecasts on the economy, securities markets or the economic trends of the markets are not necessarily indicative of the future or likely performance of Eastspring Investments or any of the funds managed by Eastspring Investments.
Information herein is believed to be reliable at time of publication. Data from third party sources may have been used in the preparation of this material and Eastspring Investments has not independently verified, validated or audited such data. Where lawfully permitted, Eastspring Investments does not warrant its completeness or accuracy and is not responsible for error of facts or opinion nor shall be liable for damages arising out of any person’s reliance upon this information. Any opinion or estimate contained in this document may subject to change without notice.
Eastspring Investments companies (excluding joint venture companies) are ultimately wholly owned/indirect subsidiaries of Prudential plc of the United Kingdom. Eastspring Investments companies (including joint venture companies) and Prudential plc are not affiliated in any manner with Prudential Financial, Inc., a company whose principal place of business is in the United States of America or with the Prudential Assurance Company Limited, a subsidiary of M&G plc (a company incorporated in the United Kingdom).