Executive Summary
- Technology and innovation are expected to contribute to 43% of Asia’s expected GDP growth from 2020 to 2030.
- The weight of the technology sector in the MSCI Asia Pacific Index rose from 15% in 2005 to 20% in 20251, reflecting the region’s structural shifts and presenting diverse opportunities for investors.
- Given the different drivers and capital allocation needs within Asia’s tech supply chain, an active approach is needed to understand where the intersection of income and growth lies in order to fully capture the unique opportunities.
Asia continues to be a major driver of global growth, with GDP forecasted to rise by 3.9% in 2025 and 4% in 20262, even amid geopolitical tensions, tariffs, and policy uncertainty. As the region grows more diverse and dynamic, an active investment approach is essential not only to stay in sync with the forces reshaping the region but also to capture the full spectrum of opportunities.
Our 2025 Asian Expert Series, presented via curated chart sets, delves into three such transformative forces (technology-led innovation, consumer-fuelled growth, sustainability-driven progress) and reinforces the rationale for Asia to remain a vital component of investor portfolios.
Technology-led innovation helps to unlock the region’s economic growth, accelerate transition and shape new markets. Whether it is India’s “Silicon Valley”, Japan’s Tsukuba Science City or Taiwan’s Hsinchu Science Park, innovation is firmly embedded in Asia’s development story. Importantly, Asia’s listed technology companies span a wide range of industries, presenting diverse equity opportunities for investors.
Emerging innovation leader
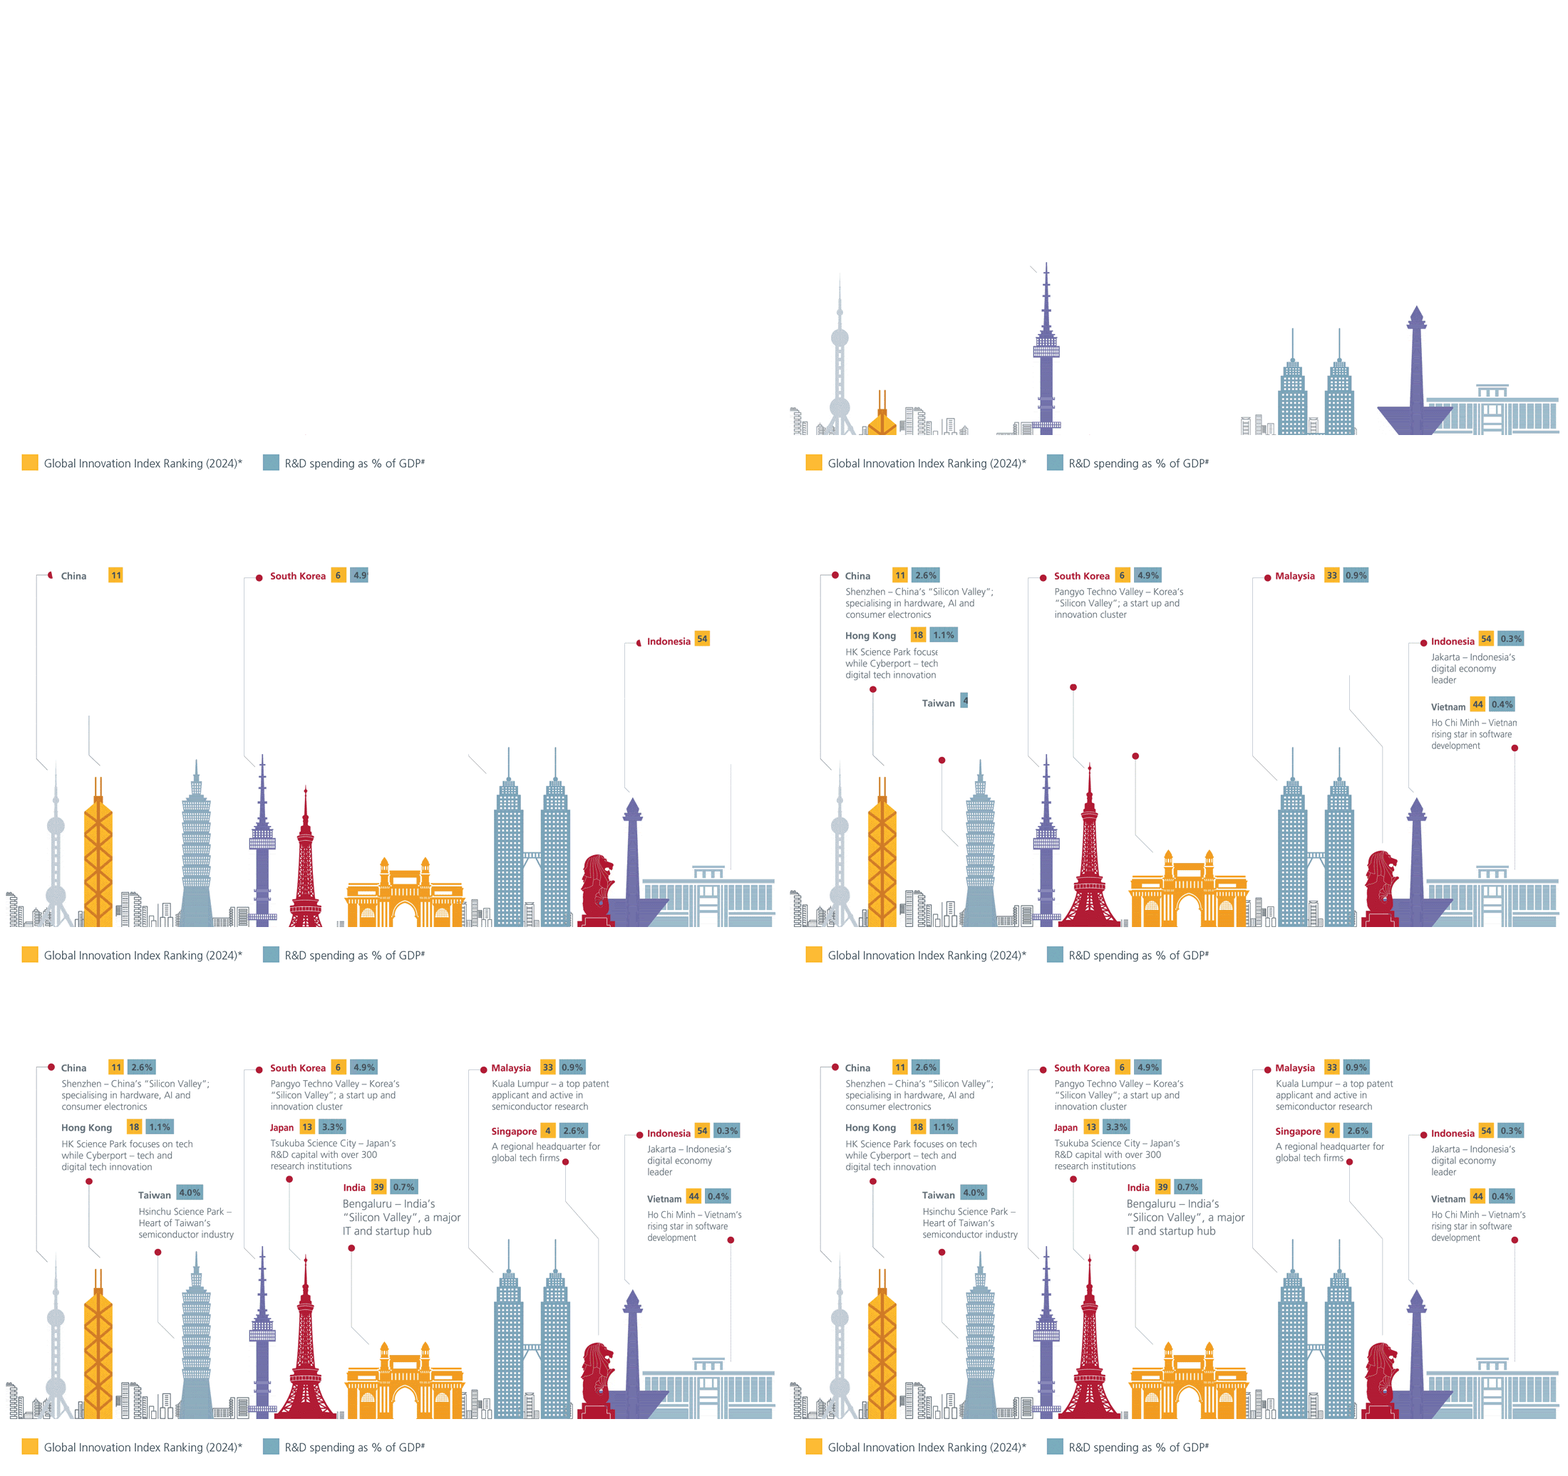
Technology and innovation drove about 50%3 of Asia’s GDP growth between 2010 and 2020 and is expected to contribute to 43%4 of the region’s expected GDP growth from 2020 to 2030. Robust R&D investment and a supportive regulatory landscape have fuelled the rise of innovation hubs across Asia.
Fig. Asia’s selected innovation zones

Source: R&D spending as % of GDP: Lowy Institute of Asia Power Index 2024 Edition. Statista. #Latest year available. *Global Innovation Index 2024. Unlocking the Promise of Social Entrepreneurship. June 2025.
Breadth and depth
Within equities, Asia’s listed tech companies span a wide range of industries, presenting diverse opportunities for investors. The rise of the weight of the technology sector in the MSCI Asia Pacific Index from 15% in 2005 to 20% in 20255 reflects the economic and structural shifts of the region.
Fig. Diverse equity opportunities across Asia

Source: Eastspring Investments.
Tech trek
Many of the pivotal moments in Asia’s tech timeline have brought rewarding opportunities for long-term investors from the introduction of the play station gaming console in 1994 to the production of the world’s first 5nm semiconductor chip in 2020.
Fig. Asia’s tech timeline

Source: Eastspring Investments. Company websites. Any securities illustrated are informational only and not an investment recommendation or advice.
Unicorn dreams
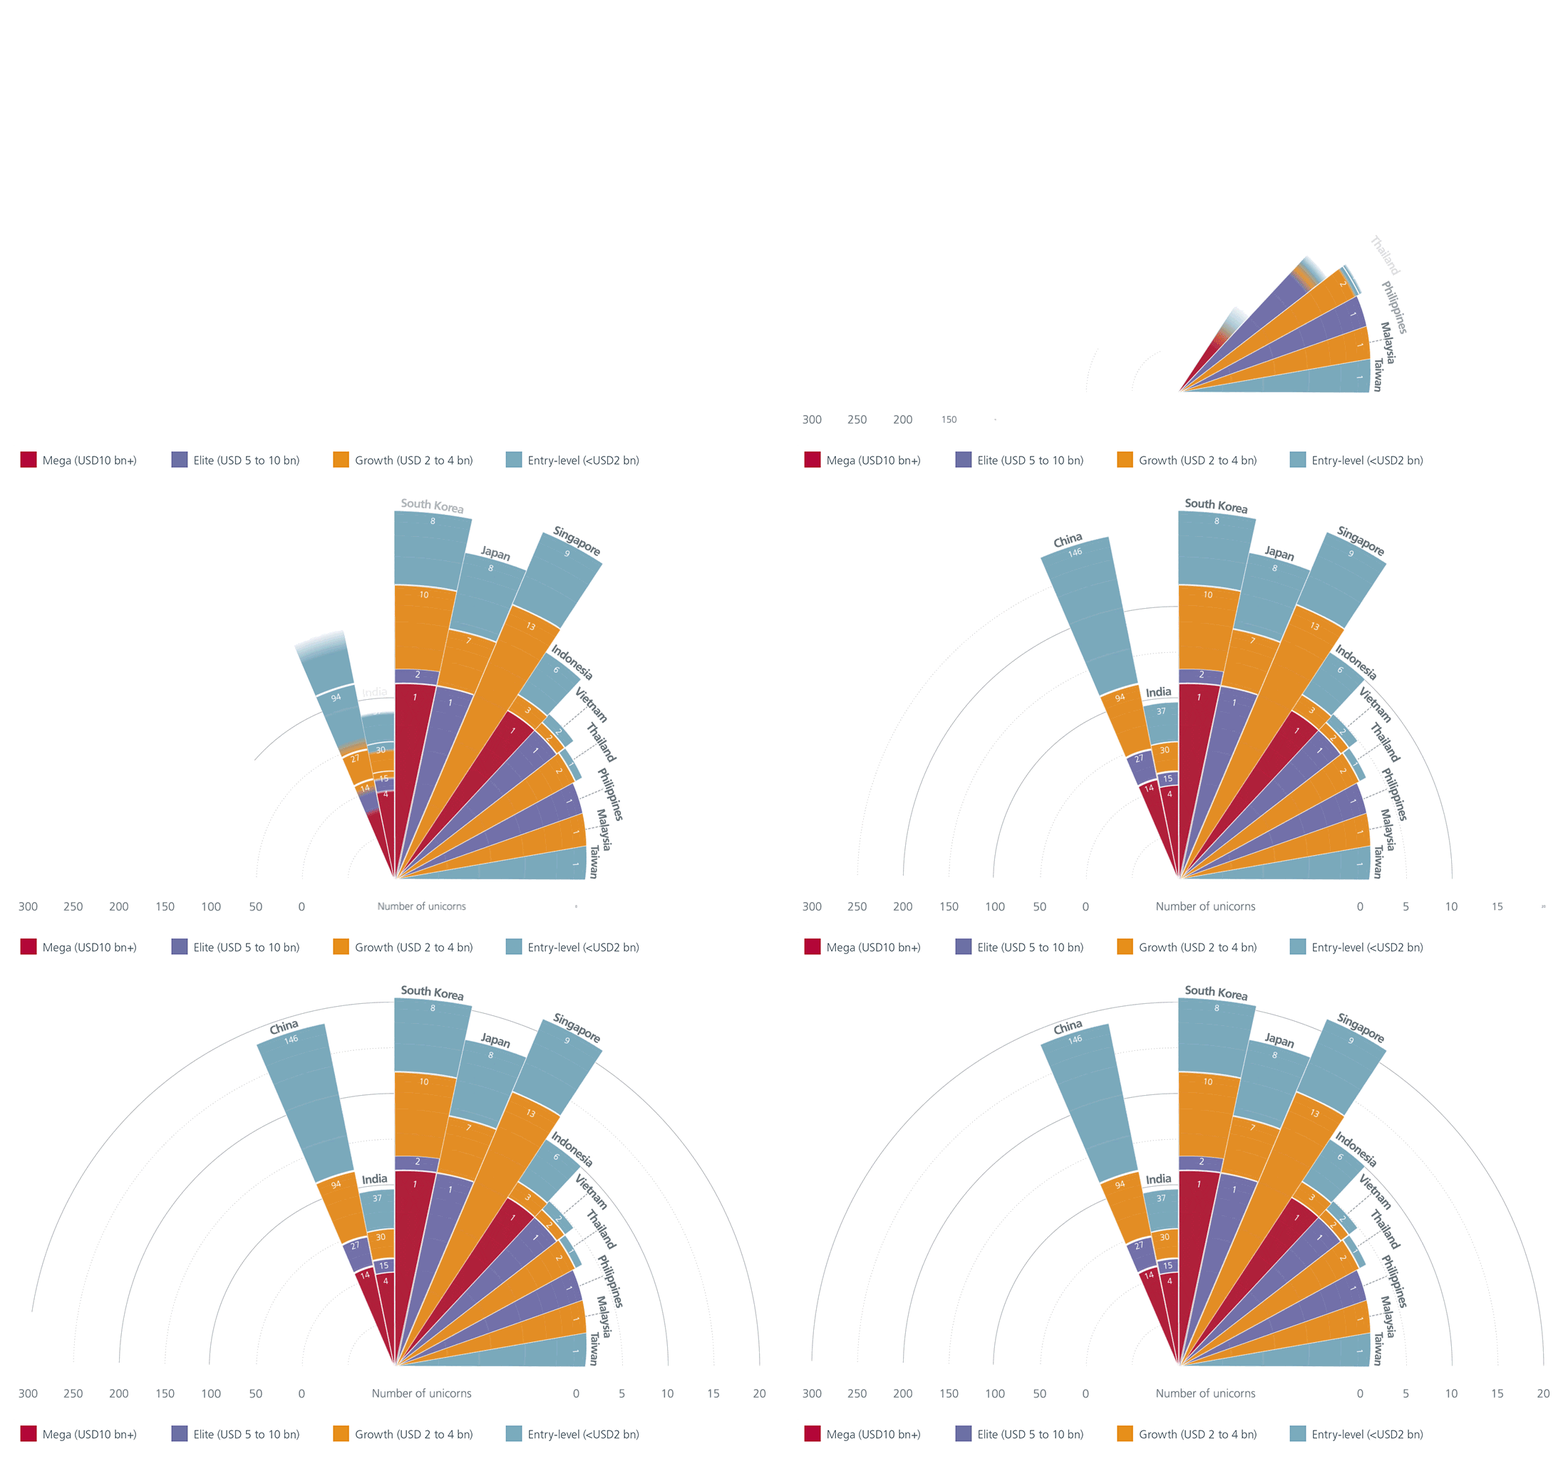
Besides being home to numerous listed tech giants, Asia also has a diverse unicorn landscape. Tensions between US and China have accelerated investments in digital infrastructure, artificial intelligence and fintech across the region. In China, unicorns predominantly concentrate on Artificial Intelligence (AI), fintech, and e-commerce. In contrast, India’s unicorn landscape is largely shaped by Software as a Service (SaaS) and edtech ventures. South Korea and Japan stand out for their emphasis on deep tech and gaming, while Southeast Asia sees its unicorns thriving in the logistics, fintech, and e-commerce sectors. Southeast Asian tech companies that had previously eyed US IPOs are increasingly pivoting to local exchanges amid rising private equity support and domestic reforms. However, investors will still need to be discerning.
Fig. Asia’s diverse unicorn landscape (2025)

Source: Global Unicorn Report 2025. June 2025. Reflects privately-held start ups valued at USD1 billion or more, often backed by venture capital. Southeast Asia’s IPOs poised for rebound in 2025 but clouds loom – Nikkei Asia. Jan 2025. Top IPOs to watch in 2024 – APAC region. AlphaSense. March 2025.
Think active
Asia’s tech sector offers a compelling blend of capital gains and dividend income. However, the dispersion of performance across the sector increases the importance of a research-driven, stock picking approach to uncover winners and mitigate downside risks. With the tech supply chain in Asia being incredibly deep and diverse with different drivers and capital allocation needs, investors have to focus on fundamentals to understand where the intersection of income and growth lies in order to fully capture the unique opportunities.
Distribution of returns of Asian tech stocks (2015 – 2025)

Source: 10-year annualised returns (or longest available annualised returns) of constituents of the MSCI Asia Pacific Information Technology Index. As of June 2025.
Explore our other themes : Asia’s consumer-fuelled growth and Asia’s sustainability-driven progress.
Sources:
1 Datastream as of 11 June 2025.
2 IMF, April 2025
3 McKinsey Global Growth Model. Total factor productivity, a broad measure of the contribution to the economy of technology and innovation.
4 In order for Asia
to maintain about 4% GDP growth. How can Asia boost growth through technological leapfrogging. McKinsey Global Institute.
5 Datastream as of 11 June 2025. 2. UBS Research.
Singapore by Eastspring Investments (Singapore) Limited (UEN: 199407631H)
Australia (for wholesale clients only) by Eastspring Investments (Singapore) Limited (UEN: 199407631H), which is incorporated in Singapore, is exempt from the requirement to hold an Australian financial services licence and is licensed and regulated by the Monetary Authority of Singapore under Singapore laws which differ from Australian laws
Hong Kong by Eastspring Investments (Hong Kong) Limited and has not been reviewed by the Securities and Futures Commission of Hong Kong.
Indonesia by PT Eastspring Investments Indonesia, an investment manager that is licensed, registered and supervised by the Indonesia Financial Services Authority (OJK).
Malaysia by Eastspring Investments Berhad (200001028634/ 531241-U) and Eastspring Al-Wara’ Investments Berhad (200901017585 / 860682-K) and has not been reviewed by Securities Commission of Malaysia.
Thailand by Eastspring Asset Management (Thailand) Co., Ltd.
United States of America (for institutional clients only) by Eastspring Investments (Singapore) Limited (UEN: 199407631H), which is incorporated in Singapore and is registered with the U.S Securities and Exchange Commission as a registered investment adviser.
European Economic Area (for professional clients only) and Switzerland (for qualified investors only) by Eastspring Investments (Luxembourg) S.A., 26, Boulevard Royal, 2449 Luxembourg, Grand-Duchy of Luxembourg, registered with the Registre de Commerce et des Sociétés (Luxembourg), Register No B 173737.
Chile (for institutional clients only) by Eastspring Investments (Singapore) Limited (UEN: 199407631H), which is incorporated in Singapore and is licensed and regulated by the Monetary Authority of Singapore under Singapore laws which differ from Chilean laws.
The afore-mentioned entities are hereinafter collectively referred to as Eastspring Investments.
The views and opinions contained herein are those of the author, and may not necessarily represent views expressed or reflected in other Eastspring Investments’ communications. This document is solely for information purposes and does not have any regard to the specific investment objective, financial situation and/or particular needs of any specific persons who may receive this document. This document is not intended as an offer, a solicitation of offer or a recommendation, to deal in shares of securities or any financial instruments. It may not be published, circulated, reproduced or distributed without the prior written consent of Eastspring Investments. Reliance upon information in this document is at the sole discretion of the reader. Please carefully study the related information and/or consult your own professional adviser before investing.
Investment involves risks. Past performance of and the predictions, projections, or forecasts on the economy, securities markets or the economic trends of the markets are not necessarily indicative of the future or likely performance of Eastspring Investments or any of the funds managed by Eastspring Investments.
Information herein is believed to be reliable at time of publication. Data from third party sources may have been used in the preparation of this material and Eastspring Investments has not independently verified, validated or audited such data. Where lawfully permitted, Eastspring Investments does not warrant its completeness or accuracy and is not responsible for error of facts or opinion nor shall be liable for damages arising out of any person’s reliance upon this information. Any opinion or estimate contained in this document may subject to change without notice.
Eastspring Investments companies (excluding joint venture companies) are ultimately wholly owned/indirect subsidiaries of Prudential plc of the United Kingdom. Eastspring Investments companies (including joint venture companies) and Prudential plc are not affiliated in any manner with Prudential Financial, Inc., a company whose principal place of business is in the United States of America or with the Prudential Assurance Company Limited, a subsidiary of M&G plc (a company incorporated in the United Kingdom).


