


Eastspring Investments
Dec 2022 | 5 min read
Asia accounts for half of the world’s population and almost half of its GDP. It made up 50% of the global consumer class in 20201 and accounted for 55% of global internet users in 20212. The region is forecast to grow by 5% in 20233, making it the fastest growing region in the world.
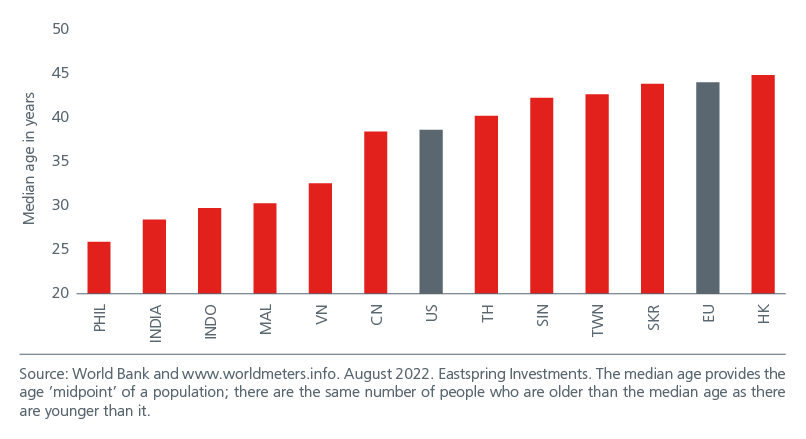
Diversity is one of the region’s most outstanding characteristics. Asia is home to high-income (South Korea, Singapore and Taiwan) economies which boast of advanced technologies and high-quality infrastructure4. Fig. 1. At the same time, the region also consists of emerging economies such as India and ASEAN that still enjoy demographic dividends with half their populations below the age of 35. Fig. 2.
Fig. 1. Asia is home to both developed and emerging economies
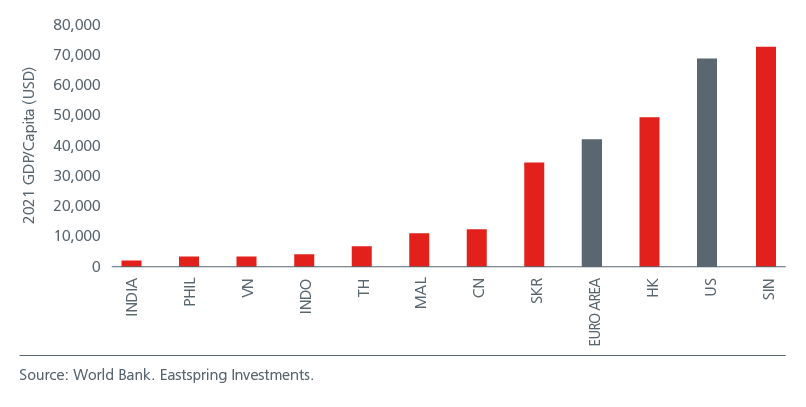
Fig. 2. Indian and ASEAN have much younger populations
While exports and competitive labour costs have driven the region’s prosperity over the last few decades, new growth drivers have emerged following the region’s progress, the peak in globalisation and rising geopolitical tensions. Given Asia’s diverse make up, these new growth drivers will play out differently across the region, creating exciting opportunities and diversification for investors.
Growth drivers for new Asia
Digitalisation
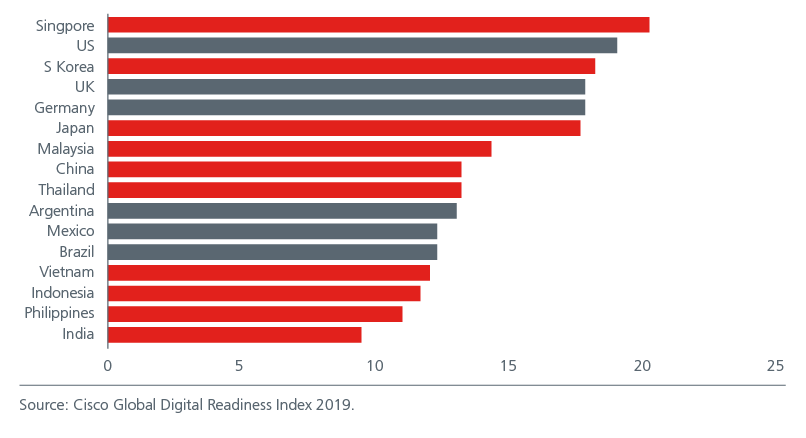
The COVID-19 pandemic has accelerated the pace of digital adoption in Asia. This is spurred by the region’s high smart phone penetration rates, mobile-savvy youthful populations, heavy investments in digital infrastructure and supportive regulatory frameworks.
Cisco’s Global Digital Readiness Index assesses countries’ digital readiness using a holistic approach that considers amongst other factors, the start-up environment, human capital, technology infrastructure as well as government and business investments. While Singapore is leading in terms of overall digital readiness, Fig. 3. reflects Asia’s heterogeneity in terms of digital readiness.
Fig. 3. 2019 Digital readiness (maximum score 25)
Digitalisation has increased financial inclusiveness and lifted operational efficiency for Asian companies. ASEAN signed a regional e-commerce agreement in 2019 which establishes common principles and rules for e-commerce growth, potentially heralding a digital common market. It is forecast that the digital economy in Southeast Asia will more than double from some USD170 billion in 2021 to USD360 billion by 2025, and then grow rapidly to about USD1 trillion by 20305. Digital readiness has become a source of competitive advantage for Asian consumer companies. It is estimated that 60 million people in Southeast Asia became online consumers during the pandemic6.
Given the different degrees of digital readiness across Asia, governments need to reduce the risk of a digital divide by ensuring that the lower income groups also get access to the internet and smart devices. This will enable Asia’s digital economy to grow in an inclusive and equitable manner.
Supply chain realignment
Geopolitical tensions and the COVID-19 pandemic are re-shaping global supply chains, causing multinational companies (MNCs) to seek more resilient supply chain networks. Besides reshoring, many MNCs are also looking to diversify their manufacturing facilities, away from China. China’s share of US imports has fallen by 7% since the start of the Sino-US trade conflict with Vietnam the main beneficiary of the sourcing shift. Vietnam’s share of US container imports rose by 6% during this period while the share accounted by the rest of ASEAN increased by 2%7. Apple has also shifted significant consumer electronics production from China to India with new manufacturing capabilities in Tamil Nadu.
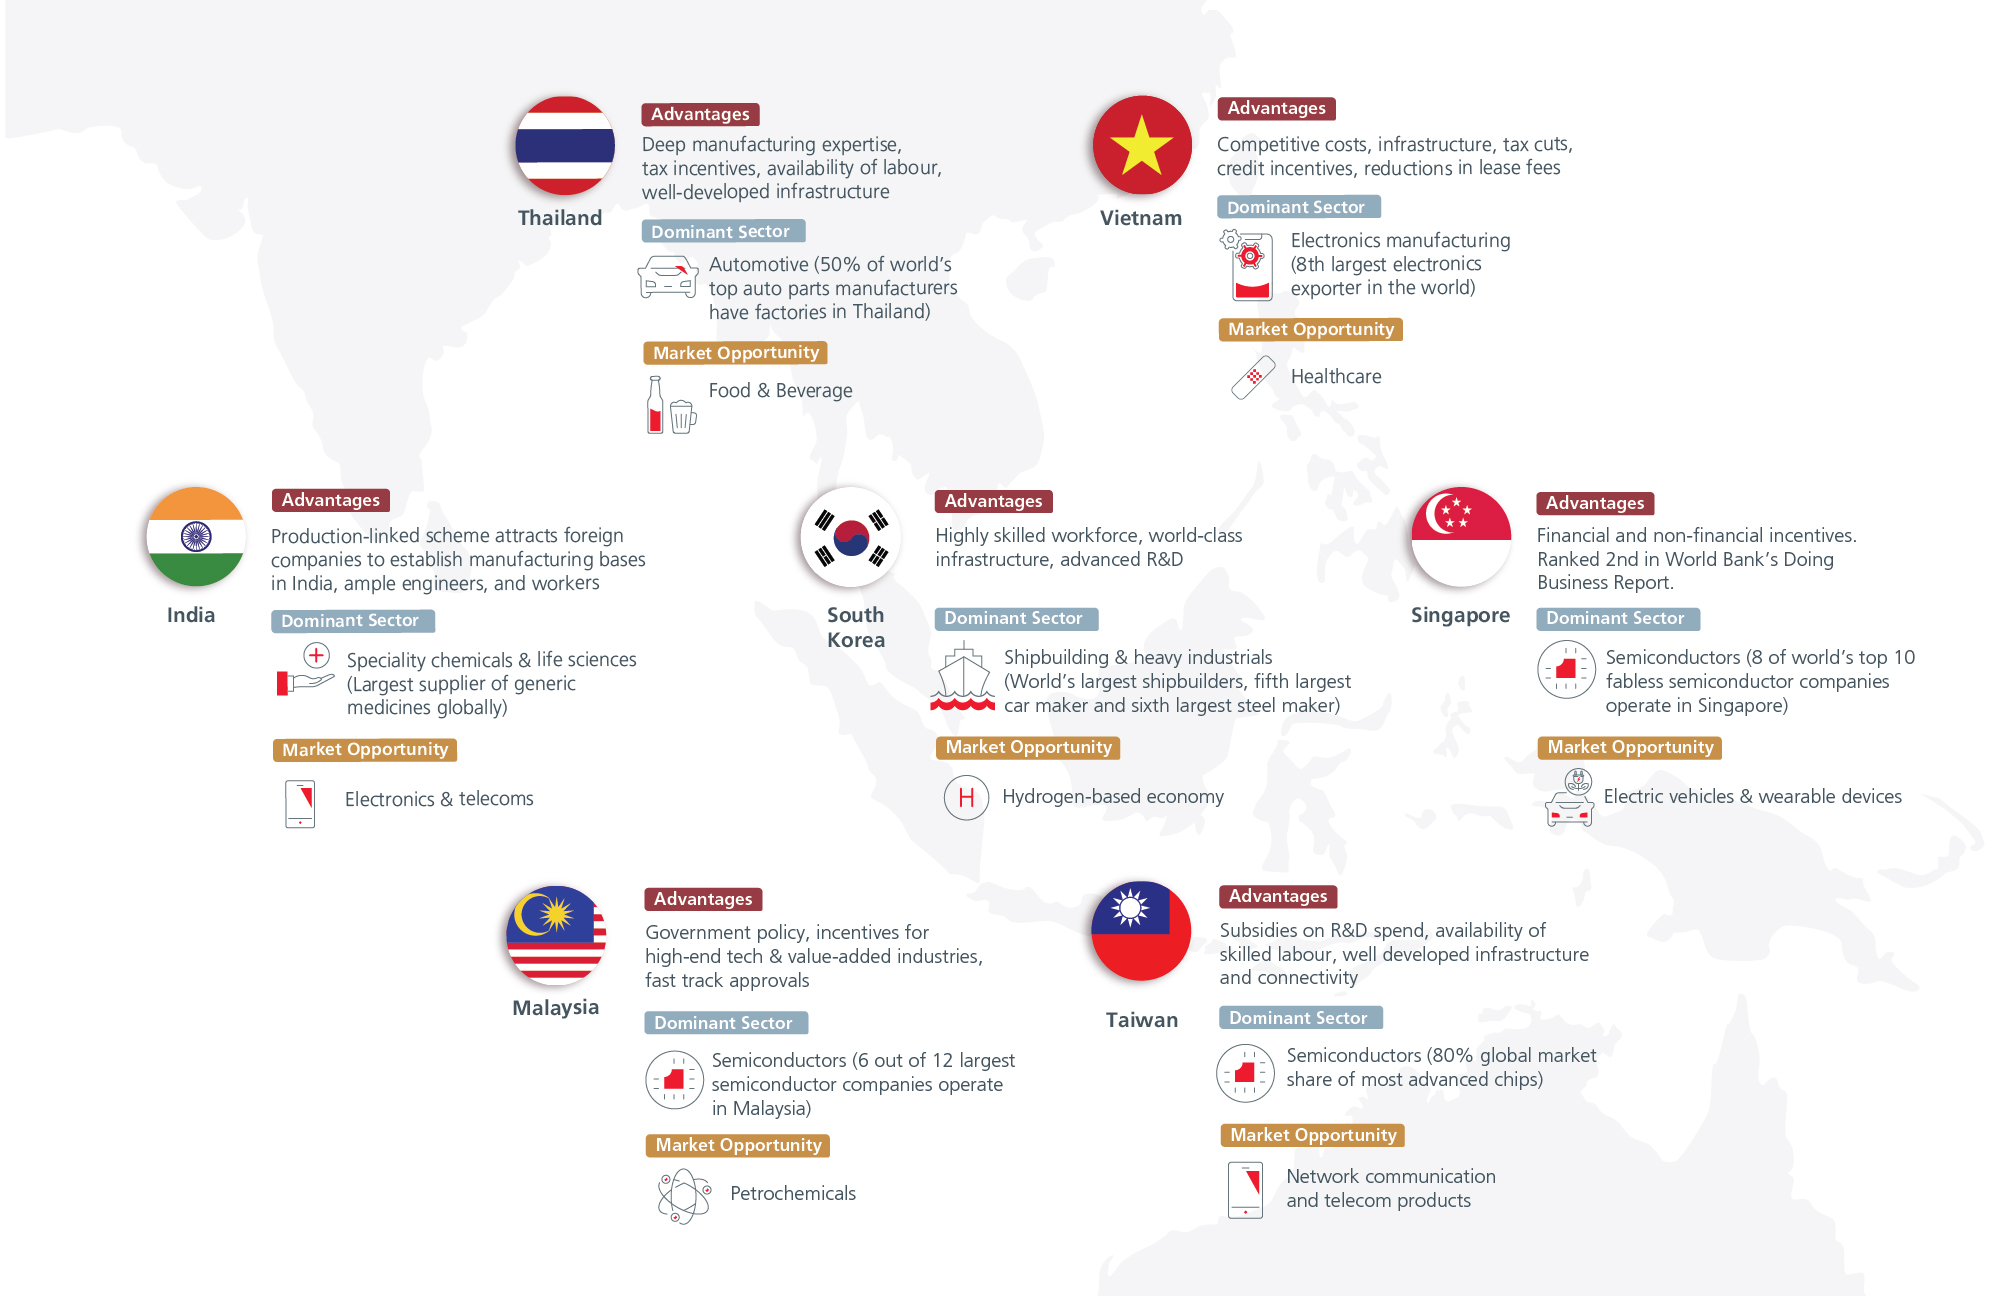
Having a manufacturing base in Asia allows MNCs to access the region’s large and growing consumer base. Labour costs in developing economies such as Vietnam, Thailand and India are also cheaper compared to the developed economies. Meanwhile, Asian governments have sought to create a comprehensive manufacturing eco-system by establishing industrial parks and dedicated manufacturing zones. Asia8 is home to 301 seaports and 612 airports which helps to facilitate a seamless flow of trade for manufacturers9, the recent disruptions caused by the COVID-19 lockdowns notwithstanding. Distinct competitive advantages have resulted in different manufacturing specialisations across the region. Fig. 4. Telsa has picked Bangaluru as the location for its first plant in India while Samsung Electronics will start manufacturing semiconductor chips in Vietnam in 2023. India’s expanding manufacturing expertise is also one of the reasons why the market is drawing renewed interest from investors.
Fig. 4. Manufacturing destinations in Asia
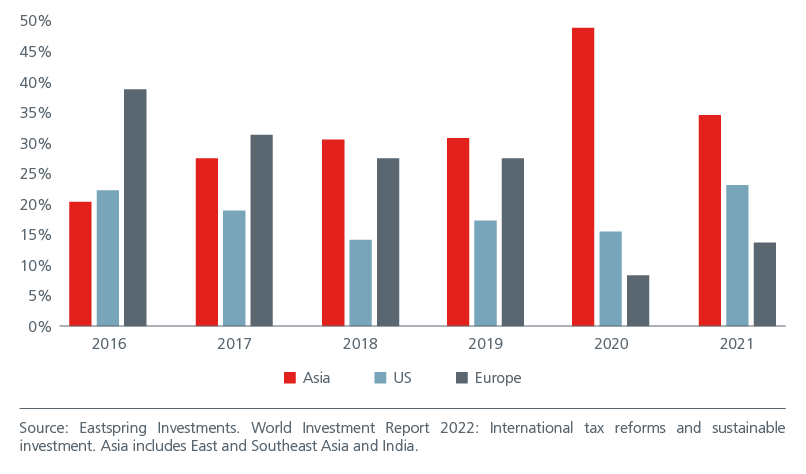
The region’s success in positioning itself as an attractive manufacturing-oriented center10 is seen from its ability to attract manufacturing Foreign Direct Investment (FDI). In 2021, FDI inflows for the region reached USD550 billion, accounting for 35% of global inflows, higher than for the US and Europe. Fig. 5. Going forward, international policies that require effective supply chain risk management systems and processes as well as supply chain due diligence and transparency will have implications for Asia. Asian corporates will need to improve on their due diligence processes in order to maintain their competitiveness as a leading global supply chain hub.
Fig. 5. Share of global FDI inflows
Technological innovation
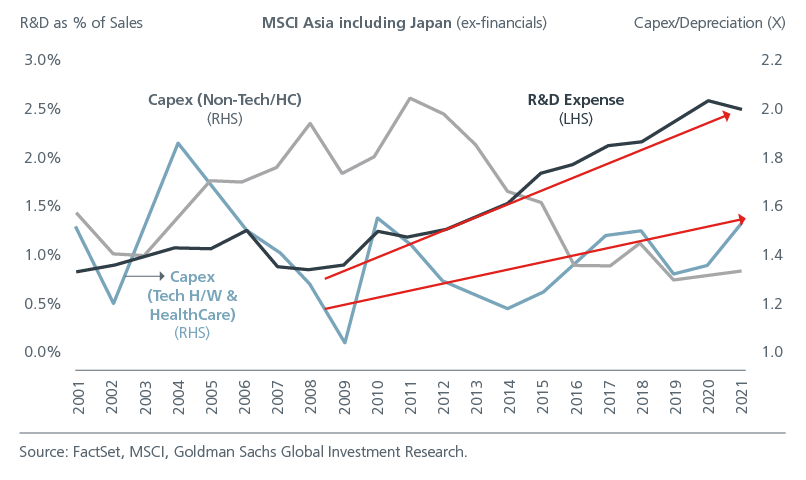
Innovation plays an important role in driving Asia’s long-term growth. According to the Asian Development Bank, countries that manage to escape the middle-income trap11 invest 3 times more in research and development and apply for 4 times as many patents12. Encouragingly, tech-related capital spending and R&D expenditure have been rising in Asia. Fig. 6.
Fig. 6. Rising tech-related and R&D spending in Asia.
Asia’s relatively youthful and technologically savvy population as well as its strong work ethic have helped to drive innovation in the region. The 2021 Bloomberg Innovation Index—which ranks the world’s most innovative 95 countries based on R&D spending, manufacturing capability, and concentration of high-tech public companies—ranks South Korea at 1, Singapore at 2, Japan at 12, and China at 16. Europe takes up 7 out of the top 10 spots in the index, while the US exited the top 10 and is ranked 11. South Korea, Taiwan, Singapore and China can be considered as frontier innovators, creating unique products and services for the world. Asia’s cutting-edge technology in Taiwan and Korea for example has established high barriers to entry and entrenched the countries’ leadership positions in semiconductor manufacturing and design. This dominance cannot be easily chipped away as it comes from decades of government support, intentional policy design, knowledge development and private sector entrepreneurship. Meanwhile, the other markets in Asia can be considered as catch-up innovators, tweaking existing products and services for first time use in their home market.
While Asia is already innovating, quality education, financial support for R&D, property rights and conducive policies are key to helping the region innovate more.
Regional partnerships
Against the ongoing tide of protectionism and anti-globalisation sentiment, greater regional integration and mega trade agreements will be important to sustain the region’s growth momentum.
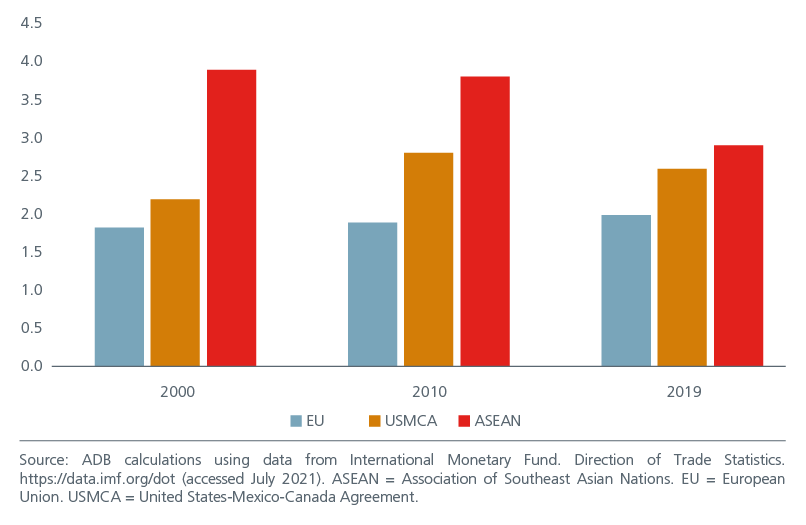
The Intraregional Trade Intensity Index (TII) measures the ratio of intra-regional trade as a share of world trade. A higher TII number implies that the region’s trade is oriented more towards its member countries than towards the rest of the world. While supply chains in Asia have helped meet demand in other regions, companies are also setting up supply chains in the region to service Asian markets13. Asia’s progress, affluence and diversity have created a dynamic ecosystem of buyers and sellers, allowing it to increasingly cater to its own final demand. Although ASEAN’s TII fell in 2019 (partly as a result of the COVID-19 lockdowns), it is higher than for the EU and North America. Fig. 7. Intra-regional trade within Asia and ASEAN is expected to rise as the Regional Comprehensive Economic Partnership (RCEP) incentivises the rebuilding of supply chains in the region.
Fig. 7. Intraregional Trade Intensity in higher in ASEAN
The RCEP came into effect in January 2022 and is a free trade agreement (FTA) between the 10 ASEAN economies and its FTA partners. RCEP accounts for 31% of global GDP, 29.7% of the world’s population and 29% of global trade. The diversity among RCEP members offers scope for complementary investments within the region. It is estimated that by 2030, RCEP will increase members’ income by 0.6%, regional income by USD245 billion and regional employment by 2.8 million jobs14.
There is also high regional cooperation and integration across Asia beyond trade. The Asian Development Bank’s Asia-Pacific Regional Cooperation and Integration Index tracks integration and cooperation across eight dimensions. Asia and the Pacific exceeded the other regions in technology and digital connectivity and performed equally as the EU in investment and value chain participation . On the other hand, there is room for greater environmental cooperation - Asia’s efforts are close to three-quarters of those in the EU and North America, the top performing regions.
Sustainability
Climate change is expected to have a significant impact on Asia with the potential to degrade productivity, agricultural yields, supply chains and infrastructure. That said, according to McKinsey & Company, “Asia is well positioned to address these challenges and capture the opportunities that come from managing climate risk effectively”16. Asian governments are increasingly incorporating sustainability in their economic agendas.
For example, under the ASEAN Plan of Action for Energy Cooperation (APAEC), the region aims for renewable energy to account for 23% of total primary energy supply and 35% of installed power capacity by 2025. Meanwhile, India has a goal to produce a cumulative 5m tonnes of hydrogen by 2030 as well as to bring down the cost of green hydrogen to USD2.50/kg by 2025 and to USD1/kg by 2030.
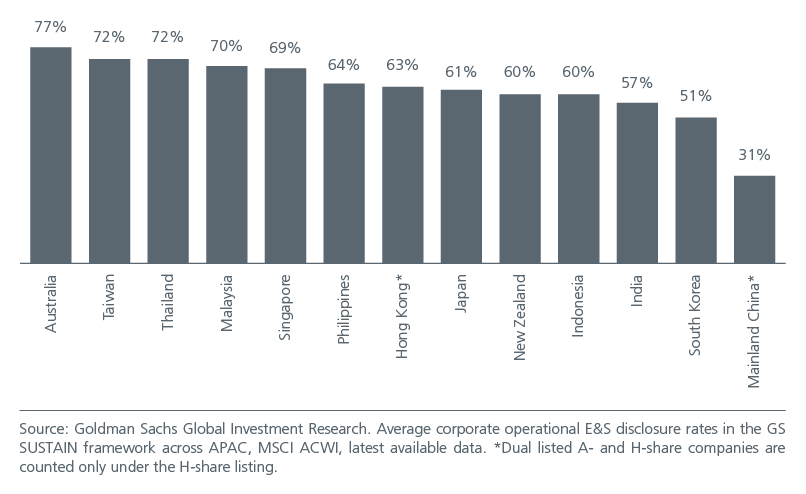
The number of ESG policies has risen sharply in Asia over the last five years although the ESG disclosure rate differs across the region. Fig. 8 and 9. Research shows that Asian companies that are highly aligned to the EU ESG Taxonomy have been able to trade at a premium (~55% on P/E and 64% on EV/EBITDA terms) relative to their sector peer groups17. As more Asian companies align themselves to the EU ESG Taxonomy, or as more APAC taxonomies leverage on the EU taxonomy, there is potential for increased ownership by ESG funds and hence higher valuations.
Fig. 8. No. of ESG policies by region
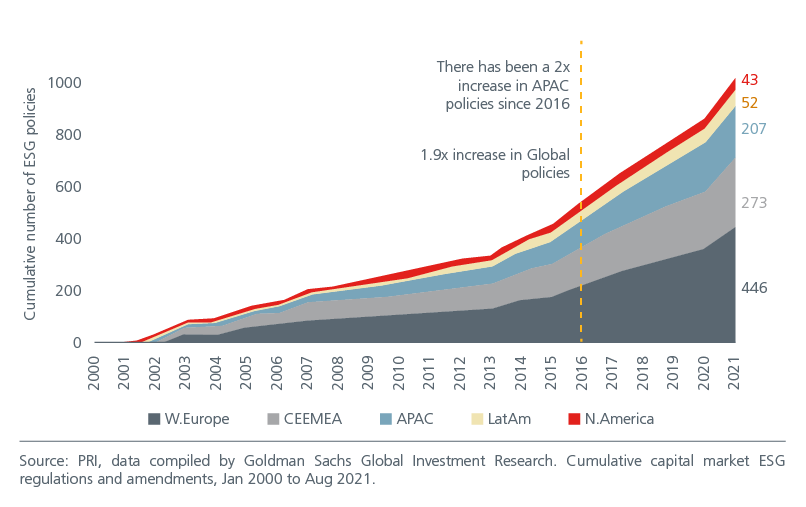
Fig. 9. ESG corporate disclosure rates across Asia Pacific
There will be opportunities for investors as companies try to align themselves to their governments’ net zero targets. China was the world’s largest producer of EV batteries in 2021, accounting for 79% of global manufacturing capacity18. China also manufactures 60% of all the world’s electric cars19 and has a near monopoly in solar panel manufacturing. Meanwhile, as South Korea accelerates towards a hydrogen-based economy, local companies that supply hydrogen fuel cells, manufacture hydrogen mobility vehicles, and distribute liquefied hydrogen will benefit from this transition.
Compelling diversity
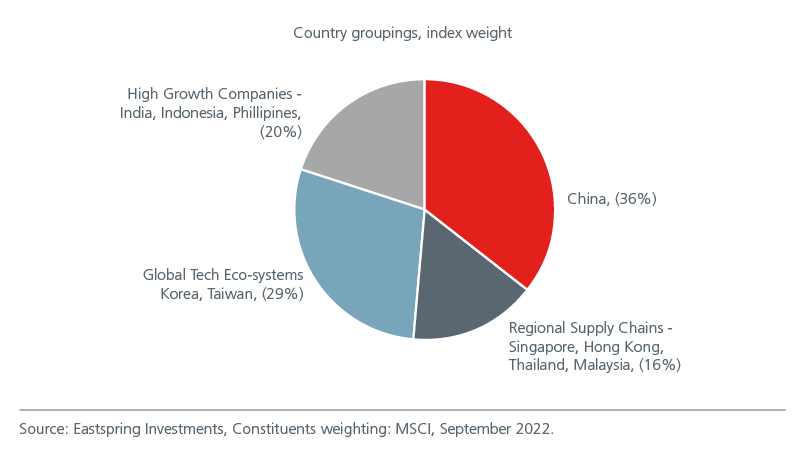
While rising geopolitical tensions may raise investor concerns about investing in selected Asian markets, there is sufficient diversify within the region that grants investors exposure to less correlated growth drivers. Fig. 10
Fig. 10. Asia offers diversified exposure to different growth drivers
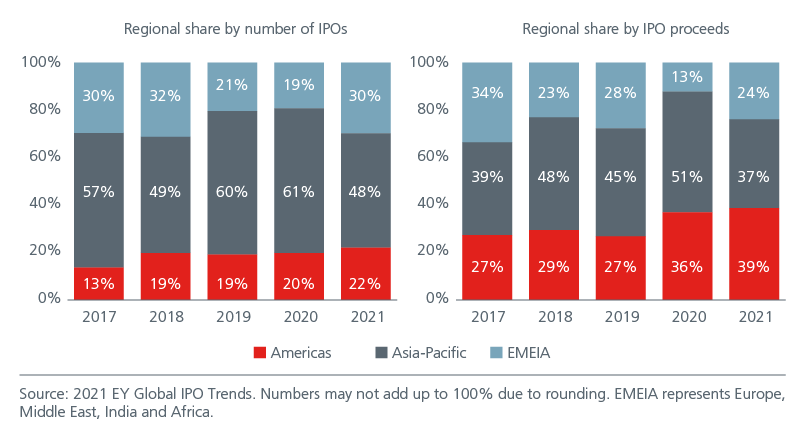
Asia’s diversity also extends to its companies. While TSMC, Samsung Electronics and Reliance Industries may be well-known names, robust IPO activity presents new opportunities for investors. Asia Pacific had the largest share of global IPO proceeds from 2017 to 2020 and accounted for 37% of global IPO proceeds in 2021. Fig. 11. In recent years, we have seen how the new listings of fin-tech and e-commerce related companies have increasingly changed the make-up of the Indonesian and Indian equity markets.
Fig. 11. Regional share by number of IPOs and proceeds
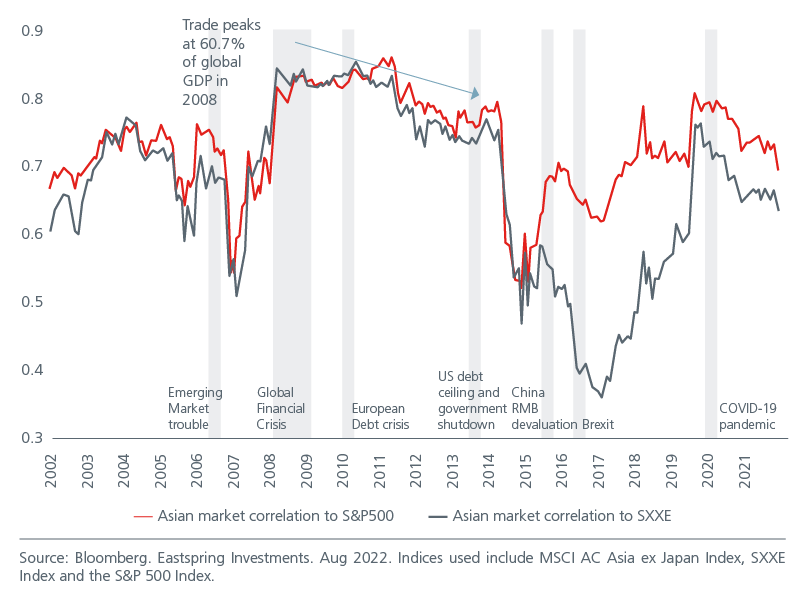
Asia’s diversity coupled with some of the markets’ relative inefficiency helps to increase the diversification benefits to international investors. Some of the less developed equity markets in Asia still have restrictions on hedging and shorting. At the same time, idiosyncratic factors including election cycles and central bank policies also drive Asian markets differently from their US and European counterparts. With the peak in global trade (as a % of global GDP) in 2008, we note that the correlation of Asian markets to the US and European equity markets have trended lower, strengthening the case for an Asian allocation to global portfolios for added diversification. See Fig. 12. However, given that Asia’s weight within the MSCI World Index has remained relatively stable around 9 to 10% since 2009, global investors who desire exposure to Asia’s dynamism and diversification benefits may consider a direct allocation.
Fig. 12. Asian market correlations to the US and European equity markets
Why Asia now?
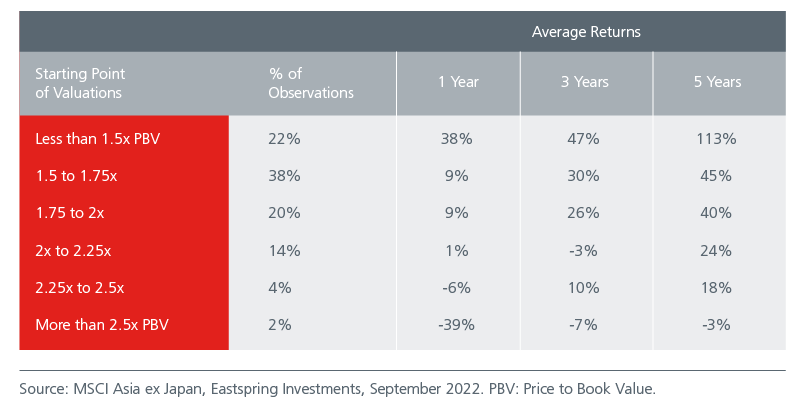
MSCI AC Asia ex Japan is attractively priced, currently trading close to one standard deviation below its historical price to book level. Fig. 13. Historically, such valuations have led to compelling market returns over the next 1-, 3- and 5-year periods. Fig 14.
Fig. 13. Asia is trading well below its average price to book level
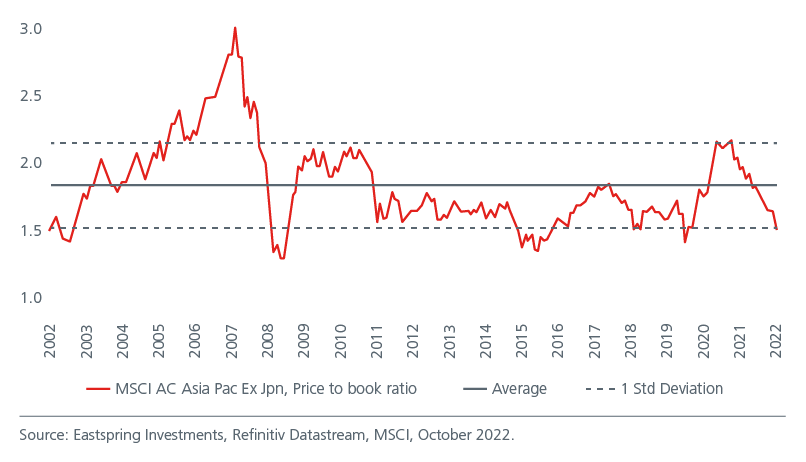
Fig. 14. Starting valuations matter
Asia is on the cusp of a new growth era which potentially warrants a larger share in asset allocations and a more thoughtful consideration of other markets beyond the incumbents. Asia’s economies and corporates are responding to a changing landscape that is shaped by new geopolitical alliances, accelerating technology and climate challenges. Armed with lessons from the pandemic, leading companies will build new capabilities, increase productivity, and expand profits. In “New Asia”, the gap between winners and losers is likely to widen. Investors who have a good understanding of local nuances and can navigate each market’s unique landscape will be better positioned to add alpha.
Look out for our 2023 Asian Expert Series on “New Asia” where we delve deeper into some of the growth drivers highlighted in this article.
Sources:
1 Brookings. Defined as anyone earnings more than USD11/day in 2011 PPP terms.
2 Globaldata.com
3 IMF, World Economic Outlook Update, July 2022.
4 Singapore is the global leader in overall infrastructure with a value of 95.4 on a scale of 0 to 100 (2019). Source Statista.
5 Roaring 20’s: The SEA Digital Decade. Google, Temasek and Bain & Company.
6 Nikkei Asia. COVID's striking impact on Southeast Asia's digital economy. November 2021.
7 BofA. Supply chains: when do the disruptions end, and how are supply chains shifting ASEAN? August 2022.
8 Asia here includes Hong Kong, India, Malaysia, Singapore, Vietnam, Thailand and Taiwan.
9 KPMG. Rethinking supply chains in Asia Pacific. October 2021.
10 hinrich foundation. Can foreign direct investment help economies climb global value chains? May 2022.
11 The middle-income trap captures a situation where a middle-income country can no longer compete internationally in standardized, labor-intensive goods because wages are relatively too high, but it also cannot compete in higher value-added activities on a broad enough scale because productivity is relatively too low.
12 Asian Development Outlook 2020: What drives innovation in Asia?
13 Asia’s future is now. McKinsey Global Institute. 2019.
14 Asian Development Bank. https://blogs.adb.org/blog/three-areas-where-rcep-may-help-region-s-post-pandemic-recovery
15 Asian Development Bank. Asia Regional Integration Center. Asia-Pacific Regional Cooperation and Integration Index Database. https://aric.adb.org/database/arcii (accessed October 2021).
16 Climate risk and response in Asia. McKinsey Global Institute. November 2020.
17 A new era for ESG in Asia Pacific. Goldman Sachs Equity Research. February 2022.
18 https://www.visualcapitalist.com/sp/mapped-ev-battery-manufacturing-capacity-by-region/
19 https://asia.nikkei.com/Spotlight/Electric-cars-in-China/China-led-world-with-500-000-electric-car-exports-in-2021
Singapore by Eastspring Investments (Singapore) Limited (UEN: 199407631H)
Australia (for wholesale clients only) by Eastspring Investments (Singapore) Limited (UEN: 199407631H), which is incorporated in Singapore, is exempt from the requirement to hold an Australian financial services licence and is licensed and regulated by the Monetary Authority of Singapore under Singapore laws which differ from Australian laws
Hong Kong by Eastspring Investments (Hong Kong) Limited and has not been reviewed by the Securities and Futures Commission of Hong Kong.
Indonesia by PT Eastspring Investments Indonesia, an investment manager that is licensed, registered and supervised by the Indonesia Financial Services Authority (OJK).
Malaysia by Eastspring Investments Berhad (200001028634/ 531241-U) and Eastspring Al-Wara’ Investments Berhad (200901017585 / 860682-K).
Thailand by Eastspring Asset Management (Thailand) Co., Ltd.
United States of America (for institutional clients only) by Eastspring Investments (Singapore) Limited (UEN: 199407631H), which is incorporated in Singapore and is registered with the U.S Securities and Exchange Commission as a registered investment adviser.
European Economic Area (for professional clients only) and Switzerland (for qualified investors only) by Eastspring Investments (Luxembourg) S.A., 26, Boulevard Royal, 2449 Luxembourg, Grand-Duchy of Luxembourg, registered with the Registre de Commerce et des Sociétés (Luxembourg), Register No B 173737.
Chile (for institutional clients only) by Eastspring Investments (Singapore) Limited (UEN: 199407631H), which is incorporated in Singapore and is licensed and regulated by the Monetary Authority of Singapore under Singapore laws which differ from Chilean laws.
The afore-mentioned entities are hereinafter collectively referred to as Eastspring Investments.
The views and opinions contained herein are those of the author, and may not necessarily represent views expressed or reflected in other Eastspring Investments’ communications. This document is solely for information purposes and does not have any regard to the specific investment objective, financial situation and/or particular needs of any specific persons who may receive this document. This document is not intended as an offer, a solicitation of offer or a recommendation, to deal in shares of securities or any financial instruments. It may not be published, circulated, reproduced or distributed without the prior written consent of Eastspring Investments. Reliance upon information in this document is at the sole discretion of the reader. Please carefully study the related information and/or consult your own professional adviser before investing.
Investment involves risks. Past performance of and the predictions, projections, or forecasts on the economy, securities markets or the economic trends of the markets are not necessarily indicative of the future or likely performance of Eastspring Investments or any of the funds managed by Eastspring Investments.
Information herein is believed to be reliable at time of publication. Data from third party sources may have been used in the preparation of this material and Eastspring Investments has not independently verified, validated or audited such data. Where lawfully permitted, Eastspring Investments does not warrant its completeness or accuracy and is not responsible for error of facts or opinion nor shall be liable for damages arising out of any person’s reliance upon this information. Any opinion or estimate contained in this document may subject to change without notice.
Eastspring Investments companies (excluding joint venture companies) are ultimately wholly owned/indirect subsidiaries of Prudential plc of the United Kingdom. Eastspring Investments companies (including joint venture companies) and Prudential plc are not affiliated in any manner with Prudential Financial, Inc., a company whose principal place of business is in the United States of America or with the Prudential Assurance Company Limited, a subsidiary of M&G plc (a company incorporated in the United Kingdom).