

Eastspring Investments
Feb 2023 | 4 min read
Summary
Emerging Market Debt is a very attractive asset class, offering high total returns matching those of equities at a lower risk. However, from time to time, it too faces periods of more pronounced losses, as occurred last year. The aftermath of such drawdowns has historically proven to be the right moment to build a larger exposure in the asset class in order to profit from high returns.
Following 2022’s sharp drawdowns across the bond complex, it is timely for investors to consider building up their bond exposures. Against the backdrop of slowing global economic growth, peaking inflation, dollar strength as well as potential inflection points in the Fed’s tightening, the outlook for emerging market debt (EMD) appears particularly attractive. As inflation stays elevated and erodes the attraction of cash, EMD offers compelling income which can provide investors some buffer from volatile equity markets as recession concerns continue to take centre stage during the new year.
Attractive upside potential
Developed and Emerging Market (EM) economic growth is forecasted to be more muted going into 2023. The slowdown in the developed economies is likely to dampen the demand for goods. While the demand for services is expected to be more resilient, services trade only accounts for less than 20% of goods trade in the EMs1. That said, China’s impending economic rebound is likely to provide some offset to EM. Nevertheless, EMD appears to have largely priced in the known risks.
Inflation appears to have peaked in the EMs. See Fig. 1. Compared to Developed Market central banks, EM central banks in general had tightened much earlier and had achieved some success in containing inflation expectations.
Fig. 1. EM inflation appears to have peaked
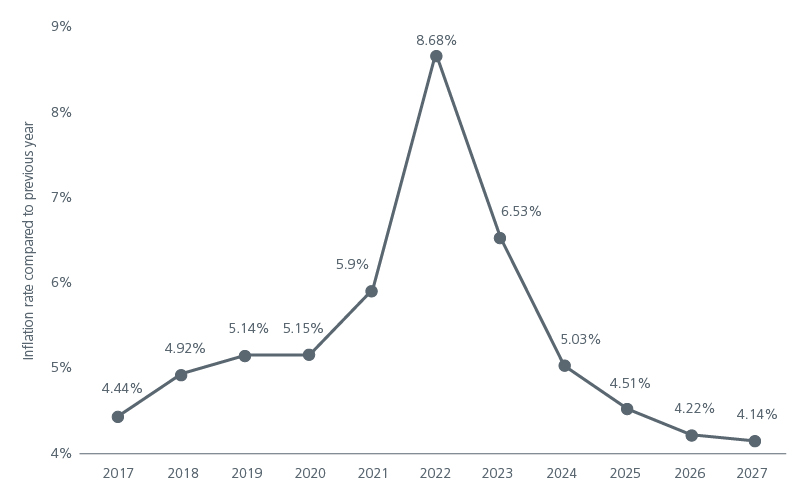
Source: Statista 2023. Figures for 2022-2027 are estimates
Analysis of the 10 most recent episodes of significant bond market drawdowns shows that the average drawdown for EMD was around 20% over four months, with the average recovery of about 28% over 8 months. Subsequent gains after the drawdowns averaged 28% and 49% respectively over the next 12 to 24 months. If history repeats itself, the potential upside appears very attractive for EMD. See Fig. 2.
Fig. 2. Attractive upside for EMD
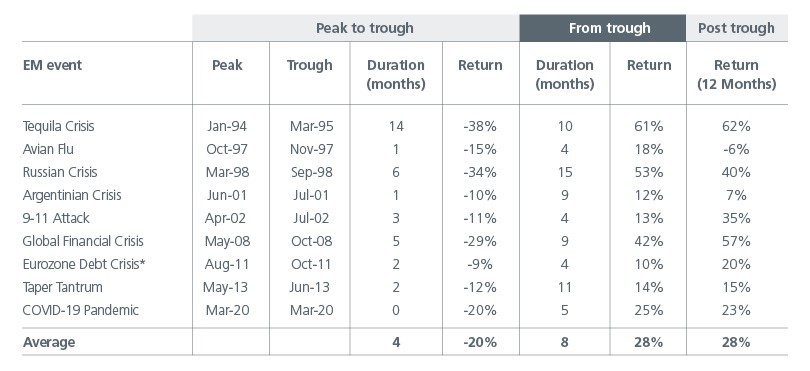
Source: As of January 3, 2023. Source: Bloomberg, JPMorgan. Past performance is not necessarily indicative of future results. All performance is quoted as index total returns for the JPMorgan Emerging Markets Bond Index Global (EMBIG Index) which tracks total returns for U.S. Dollar-denominated debt instruments issued by emerging markets sovereign and quasi-sovereign entities: Brady bonds, loans, and Eurobonds. The index start date is Jan 1, 1994. *Total index returns for the CEMBI Broad Index which tracks the total returns of U.S. Dollar-denominated debt instruments issued by corporate entities in Emerging Markets countries. Please note that there are limitations to the use of such indices as proxies for the past performance in the respective asset classes/sector.
With EM sovereign bond yields at high-single digit levels2, this should help to buffer further bond price declines and increase the probability of positive total returns. EM real yields (in local currency terms) are currently offering more than a 5% pick-up over US real yields3. EM currencies could also contribute positively to local currency bond returns if dollar strength moderates further over 2023. Meanwhile, China’s re-opening is likely to support commodity prices, which should be positive for commodity exporters within EM.
Not all EM is created equal
Despite attractive high yields and moderating EM inflation, investors still need to be selective when investing in EMD. This can be seen from the bond defaults in Sri Lanka and Ghana in 2022. The dispersion in currency performance among the EM regions in 2022 also shows that not all in EM is created equal, with the commodity exporters’ currencies on average faring better than the Asian ones. See Fig. 3.
Fig. 3. 2022 spot returns of EM currencies (against the USD)
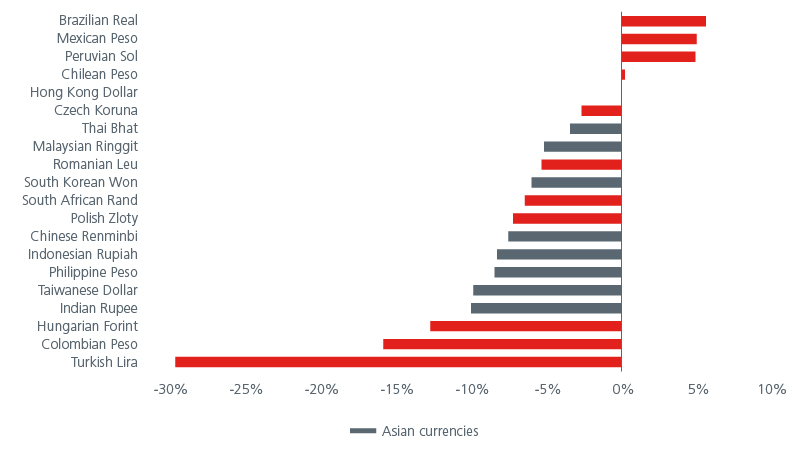
Source: Bloomberg. January 2023.
That said, the fact that the latest Fed rate hiking cycle has not triggered a widespread emerging debt crisis testifies to EM’s overall improved fundamentals as well as investor confidence. Foreign exchange reserves are now higher than before and better access to capital markets has resulted in lower levels of short-term debt. See Fig. 4. The amount of short-term debt as a percentage of reserves at the end of 2021 was below the 5-year average for a number of EMs. Therefore, despite elevated interest rates, we do not expect to see a huge wave of sovereign defaults in EM in 2023.
Fig 4: Short term debt as a percentage of reserves (%)
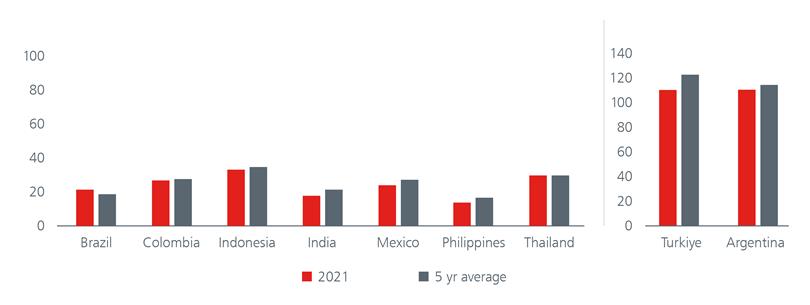
Source: World Bank. Data updated as of December 2022.
Nevertheless, investors need to be selective in their EM exposures and focus on the stories that could enjoy tailwinds going forward. Mexico’s outlook appears optimistic as it looks to benefit from the ongoing reconfiguration of US supply chains. The over-whelming rejection of the draft for Chile’s new constitution has helped to reduce the threat to its pro-market economic model. Meanwhile, Indonesia’s medium-term structural outlook is boosted by the potential for greater export diversification in processed metals and electric vehicle (EV) batteries, as well as faster than expected fiscal consolidation.
EM’s non-financial corporate balance sheets also appear healthy: Net debt to equity levels seem manageable and interest coverage is high, comparable with global standards. See Fig. 5. That said, averages may be misleading, and investors will need to dig deep and identify companies that will not only benefit from the ongoing progress in their domestic economies but are also global leaders. While the liquidity crisis amongst the Chinese property developers had weighed on the EM corporate bond market, we believe that we have passed the worst for EM corporate defaults.
Fig. 5. EM non-financial corporate balance sheets are seemingly healthy
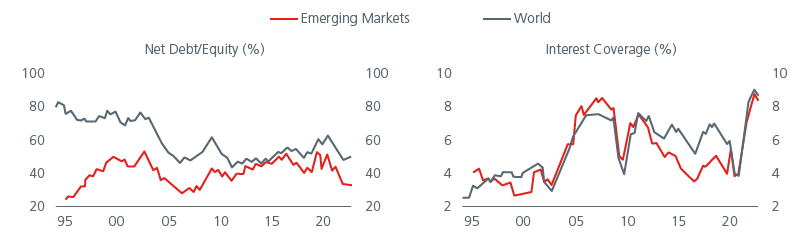
Source: Refinitiv Datastream. Eastspring Investments. November 2022.
When less may be more
After a challenging year for bond investors in 2022, the outlook appears to be brightening. EMD’s high yields, EM’s peaking inflation and positive macro stories present attractive opportunities for investors. For the full year of 2022, EMD registered inflows of USD36.6 billion, around one-tenth of 2021’s inflows, as recorded by the Institute of International Finance4. Inflows should accelerate as risk sentiment rises. History suggests that following last year’s sharp market drawdowns, the potential returns for EMD are highly compelling over the next 12 to 24 months.
When investing in EMD, less may be more. For investors who want both exposure and alpha, having a strategy that can demonstrate high conviction in selected exposures and one that has the flexibility to straddle both the sovereign and corporate bond universes is likely to be more rewarding.
Interesting reads


Sources:
1 Citi Research. Haver Analytics. December 2022.
2 Bloomberg. As of 31 January 2023.
3 Bloomberg. As of 31 January 2023.
4 Net non-resident purchases of EM bonds.
Singapore by Eastspring Investments (Singapore) Limited (UEN: 199407631H)
Australia (for wholesale clients only) by Eastspring Investments (Singapore) Limited (UEN: 199407631H), which is incorporated in Singapore, is exempt from the requirement to hold an Australian financial services licence and is licensed and regulated by the Monetary Authority of Singapore under Singapore laws which differ from Australian laws
Hong Kong by Eastspring Investments (Hong Kong) Limited and has not been reviewed by the Securities and Futures Commission of Hong Kong.
Indonesia by PT Eastspring Investments Indonesia, an investment manager that is licensed, registered and supervised by the Indonesia Financial Services Authority (OJK).
Malaysia by Eastspring Investments Berhad (200001028634/ 531241-U) and Eastspring Al-Wara’ Investments Berhad (200901017585 / 860682-K) and has not been reviewed by Securities Commission of Malaysia.
Thailand by Eastspring Asset Management (Thailand) Co., Ltd.
United States of America (for institutional clients only) by Eastspring Investments (Singapore) Limited (UEN: 199407631H), which is incorporated in Singapore and is registered with the U.S Securities and Exchange Commission as a registered investment adviser.
European Economic Area (for professional clients only) and Switzerland (for qualified investors only) by Eastspring Investments (Luxembourg) S.A., 26, Boulevard Royal, 2449 Luxembourg, Grand-Duchy of Luxembourg, registered with the Registre de Commerce et des Sociétés (Luxembourg), Register No B 173737.
Chile (for institutional clients only) by Eastspring Investments (Singapore) Limited (UEN: 199407631H), which is incorporated in Singapore and is licensed and regulated by the Monetary Authority of Singapore under Singapore laws which differ from Chilean laws.
The afore-mentioned entities are hereinafter collectively referred to as Eastspring Investments.
The views and opinions contained herein are those of the author, and may not necessarily represent views expressed or reflected in other Eastspring Investments’ communications. This document is solely for information purposes and does not have any regard to the specific investment objective, financial situation and/or particular needs of any specific persons who may receive this document. This document is not intended as an offer, a solicitation of offer or a recommendation, to deal in shares of securities or any financial instruments. It may not be published, circulated, reproduced or distributed without the prior written consent of Eastspring Investments. Reliance upon information in this document is at the sole discretion of the reader. Please carefully study the related information and/or consult your own professional adviser before investing.
Investment involves risks. Past performance of and the predictions, projections, or forecasts on the economy, securities markets or the economic trends of the markets are not necessarily indicative of the future or likely performance of Eastspring Investments or any of the funds managed by Eastspring Investments.
Information herein is believed to be reliable at time of publication. Data from third party sources may have been used in the preparation of this material and Eastspring Investments has not independently verified, validated or audited such data. Where lawfully permitted, Eastspring Investments does not warrant its completeness or accuracy and is not responsible for error of facts or opinion nor shall be liable for damages arising out of any person’s reliance upon this information. Any opinion or estimate contained in this document may subject to change without notice.
Eastspring Investments companies (excluding joint venture companies) are ultimately wholly owned/indirect subsidiaries of Prudential plc of the United Kingdom. Eastspring Investments companies (including joint venture companies) and Prudential plc are not affiliated in any manner with Prudential Financial, Inc., a company whose principal place of business is in the United States of America or with the Prudential Assurance Company Limited, a subsidiary of M&G plc (a company incorporated in the United Kingdom).