


Eastspring Investments
Apr 2023 | 5 min read
Summary
India makes up more than 15% of the MSCI Emerging Market Index. With the India economy expected to drive one fifth of global growth this decade, investors can no longer ignore the opportunities that will arise from India’s demographic dividend, rising affluence and unique sector strengths.
The Indian economy has recovered strongly from the COVID pandemic. The IMF forecasts that India’s economy will expand 6.1% this year — one of the fastest rates of any major economy — and 6.8% in 2024. India is expected to contribute 15% of 2023’s global economic expansion and drive one fifth of global growth this decade.
While India is striving to realise its economic potential, its equity market is also making big strides. India accounts for more than 15% of the MSCI Emerging Market (EM) Index, up from 6.7% in 2009. It ranks second in terms of weight within the MSCI EM Index, next only to China1.For investors, India is quickly becoming a market that is too large to ignore. Fig. 1.
Fig. 1. Country weights in MSCI EM Index (%)
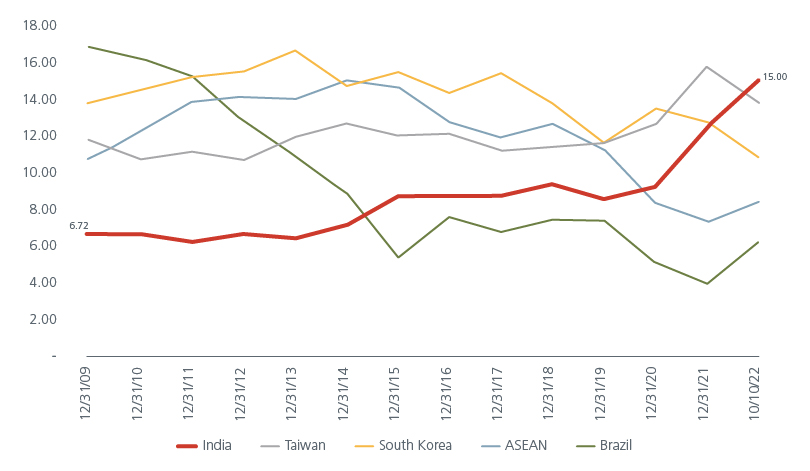
Source: Eastspring Investments (Singapore) Limited. Macquarie Research, November 2022.
India and China: Not mutually exclusive
The Sensex Index outperformed the China A-share and H-share market by 18.1% and 12.5% respectively in 2022 2.Some investors believe that this strong performance was because foreign investors were reducing their exposures in China last year, given its slowing economy and embattled property sector. As such, there are concerns that the optimism over China’s economic re-opening this year may result in foreign investor outflows from India.
In reality, in 2022, India suffered the largest foreign investor outflows it has seen in the last 12 years. It was rising domestic inflows (which tend to be sticker) that helped sustain the equity market. We believe that as global investor risk sentiment improves towards the Emerging Markets (EMs), both India and China will benefit from foreign investor inflows. While EM funds have recently increased their exposures to India, the average weight remains at multi-year lows. There is significant room for exposures to rise. Fig. 2.
Fig. 2. EM funds’ exposure to India has room to rise
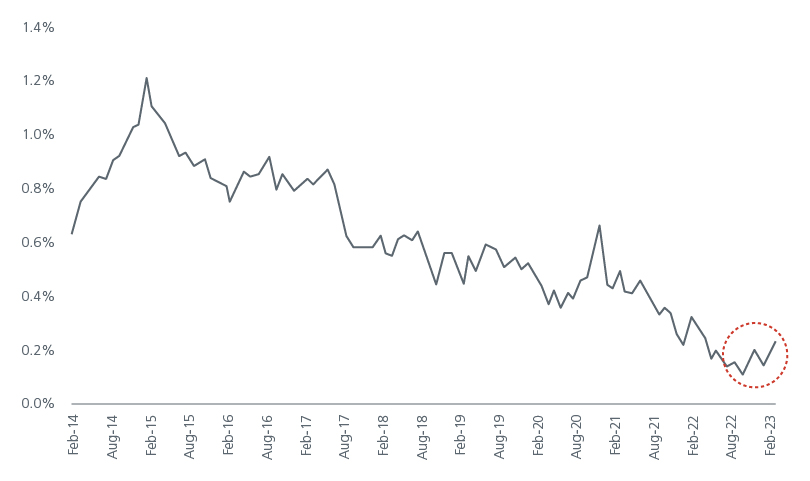
Source: BofA Global Research, BofA Asia Quantitative Strategy, MSCI, FTSE, FactSet, 13F Filings, Benchmark Indices, Country Stock Exchanges. March 2023.
In our opinion, global investors need not choose between the China and India equity markets. These markets offer opportunities in different sectors and can have complementary roles in portfolios.
For example, the MSCI India Index is skewed towards Private Sector Banks and Information Technology services which are largely dependent on US corporate tech spending. On the other hand, MSCI China has a greater representation of E-commerce and Gaming platforms, as well as state-owned banks and energy companies. Fig. 3. shows that the Consumer Discretionary sector is 28% of the MSCI China Index but just 8% of the MSCI India Index. We had highlighted previously that the MSCI India Index is one of the most diverse in Asia, and among emerging markets.
Fig. 3. Sector breakdown for India and China
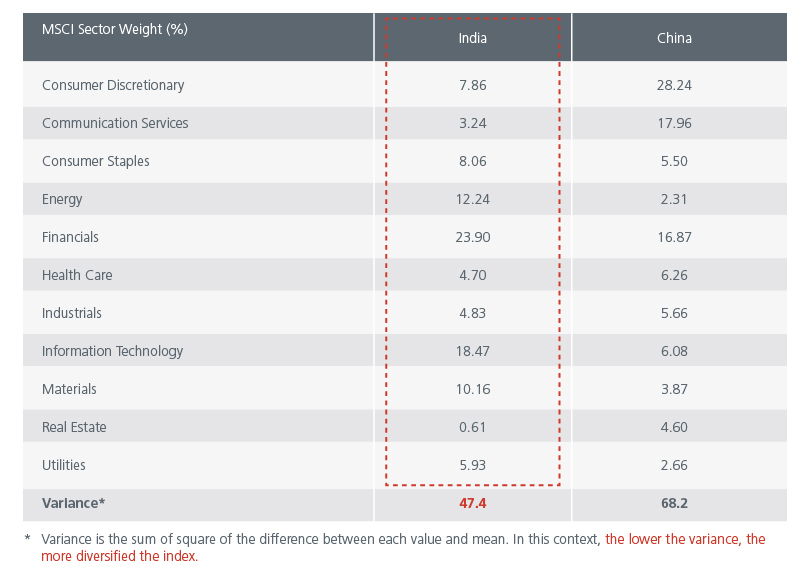
Source: Eastspring Investments (Singapore) Limited. Left Chart: MSCI. Data as at 14 February 2023.
Given such different sector exposures, it is not surprising that the 5-year correlation between both markets is one of the lowest compared to the other Asian markets. Fig. 4.
Fig. 4. MSCI India return correlations with other markets
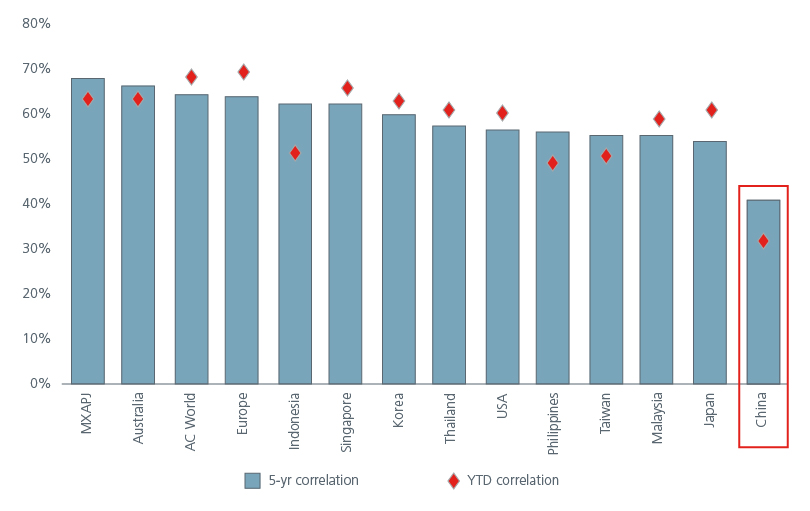
Right chart: Factset, MSCI, Goldman Sachs Global Investment Research, November 2022. The information provided herein are subject to change at the discretion of the Investment Manager without prior notice.
Tailwinds for India
We believe that the correlation between the China and India equity markets will remain low because besides offering different exposures, each economy is at a different stage of growth. India has become the world’s most populous nation and the United Nations forecasts that India’s population will continue to grow until 2050. India is expected to provide more than a sixth of the increase of the world’s working-age population (15- to 64-year-olds) between now and 2050. This will give India a significant demographic dividend, if sufficient jobs can be created for its young workforce.
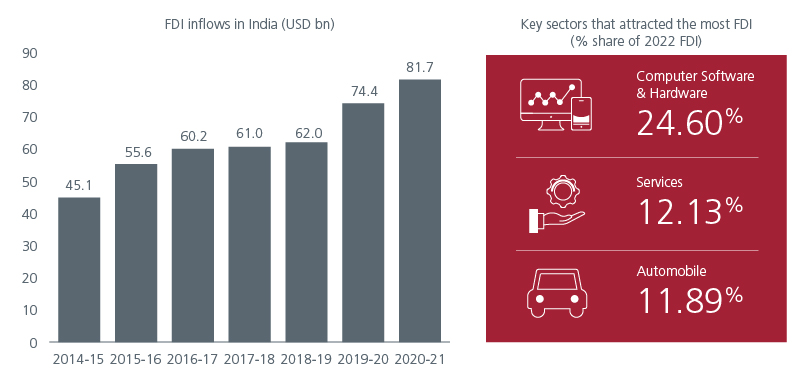
Policy direction also differs. Rising US-China tensions have led China to focus on boosting domestic consumption and increasing self-sufficiency in key sectors. Meanwhile, India is enjoying strong Foreign Direct Investment (FDI) inflows as it presents itself as an alternative location for companies looking to diversify their supply chains. India registered its highest-ever total FDI inflows of USD84.8 bn in FY2021-22. Fig. 5. The production-linked incentive (PLI) schemes which incentivises foreign manufacturers to start production in India and domestic manufacturers to expand their production have helped attract global companies to set up manufacturing bases in India. Unlike earlier schemes, PLI is much more targeted, focusing on selected sectors and incentives are disbursed based on capital expenditure and production targets.
Fig. 5. FDI inflows to India
 -->
-->
Source: LHS: Central Statistics Office, Reserve Bank of India. RHS: Ministry of Commerce and Industry, March 2023.
The recent banking sector volatility in the US and Europe could result in tighter lending standards and a further slowdown in the developed economies. India is less vulnerable to slowing global demand as exports currently make up less than 20% of GDP. On the other hand, demand for one of India’s key exports – Information Technology services - is expected to be relatively resilient. It has been observed that tech spending has increasingly decoupled from negative macro events over the decades. Relative to GDP growth, global IT services spend dipped 3x in 2009 during the Global Financial Crisis, 0.8x in 2020 and 0.3x in 2022 during the COVID-19 pandemic 3. Given higher technology wage inflation in the developed economies, India remains an attractive outsourcing destination.
This has important implications for consumer spending and economic growth as the IT sector is an important job creator for India. The rising affluence of the India consumer presents a structural opportunity for investors. India’s per capita spend on Fast Moving Consumer Goods (FMCG) stands at USD46 – Indonesia’s and China’s spend is 2x and 3x higher respectively 4.
In the 2023-2024 budget, India’s capital spending outlay was increased by 33% to Rs10 tr (USD122.3 bn), lending a boost to infrastructure development. With research suggesting that the multiplier for capital expenditure stands at 2.45 for India, this is likely to have a positive impact on economic growth over the longer term. Sectors linked to the capex upcycle such as Financials, Industrials, Cement and Steel may benefit.
Resilient India
As India seeks to ride its multiple tailwinds, there are also challenges, such as the country’s high unemployment and sticky inflation. Nevertheless, despite these challenges, the resilience of the market and its growing weight in the MSCI Emerging Markets Index reflect the appeal of India’s structural story.
Interesting reads


Sources:
1 Macquaire Research. November 2022.
2 Bloomberg. In USD terms.
3 BofA Research. March 2023.
4 Hindustan Unliever.
Singapore by Eastspring Investments (Singapore) Limited (UEN: 199407631H)
Australia (for wholesale clients only) by Eastspring Investments (Singapore) Limited (UEN: 199407631H), which is incorporated in Singapore, is exempt from the requirement to hold an Australian financial services licence and is licensed and regulated by the Monetary Authority of Singapore under Singapore laws which differ from Australian laws
Hong Kong by Eastspring Investments (Hong Kong) Limited and has not been reviewed by the Securities and Futures Commission of Hong Kong.
Indonesia by PT Eastspring Investments Indonesia, an investment manager that is licensed, registered and supervised by the Indonesia Financial Services Authority (OJK).
Malaysia by Eastspring Investments Berhad (200001028634/ 531241-U) and Eastspring Al-Wara’ Investments Berhad (200901017585 / 860682-K) and has not been reviewed by Securities Commission of Malaysia.
Thailand by Eastspring Asset Management (Thailand) Co., Ltd.
United States of America (for institutional clients only) by Eastspring Investments (Singapore) Limited (UEN: 199407631H), which is incorporated in Singapore and is registered with the U.S Securities and Exchange Commission as a registered investment adviser.
European Economic Area (for professional clients only) and Switzerland (for qualified investors only) by Eastspring Investments (Luxembourg) S.A., 26, Boulevard Royal, 2449 Luxembourg, Grand-Duchy of Luxembourg, registered with the Registre de Commerce et des Sociétés (Luxembourg), Register No B 173737.
Chile (for institutional clients only) by Eastspring Investments (Singapore) Limited (UEN: 199407631H), which is incorporated in Singapore and is licensed and regulated by the Monetary Authority of Singapore under Singapore laws which differ from Chilean laws.
The afore-mentioned entities are hereinafter collectively referred to as Eastspring Investments.
The views and opinions contained herein are those of the author, and may not necessarily represent views expressed or reflected in other Eastspring Investments’ communications. This document is solely for information purposes and does not have any regard to the specific investment objective, financial situation and/or particular needs of any specific persons who may receive this document. This document is not intended as an offer, a solicitation of offer or a recommendation, to deal in shares of securities or any financial instruments. It may not be published, circulated, reproduced or distributed without the prior written consent of Eastspring Investments. Reliance upon information in this document is at the sole discretion of the reader. Please carefully study the related information and/or consult your own professional adviser before investing.
Investment involves risks. Past performance of and the predictions, projections, or forecasts on the economy, securities markets or the economic trends of the markets are not necessarily indicative of the future or likely performance of Eastspring Investments or any of the funds managed by Eastspring Investments.
Information herein is believed to be reliable at time of publication. Data from third party sources may have been used in the preparation of this material and Eastspring Investments has not independently verified, validated or audited such data. Where lawfully permitted, Eastspring Investments does not warrant its completeness or accuracy and is not responsible for error of facts or opinion nor shall be liable for damages arising out of any person’s reliance upon this information. Any opinion or estimate contained in this document may subject to change without notice.
Eastspring Investments companies (excluding joint venture companies) are ultimately wholly owned/indirect subsidiaries of Prudential plc of the United Kingdom. Eastspring Investments companies (including joint venture companies) and Prudential plc are not affiliated in any manner with Prudential Financial, Inc., a company whose principal place of business is in the United States of America or with the Prudential Assurance Company Limited, a subsidiary of M&G plc (a company incorporated in the United Kingdom).