


Executive Summary
- Many of Japan’s small and mid-cap companies can easily improve their return on equity by using their net cash for share buybacks
- Higher share price performance of companies that disclose improvement plans will nudge more small caps to adopt balance sheet reforms
- The small and mid-cap segment is a prime market for longer term valuation-driven stock pickers; many of them are currently trading below their book value.
In the previous article, we stated key factors that will continue to support Japan’s stock market. These include the ongoing corporate reforms, the revamped savings policy which will spur investments, and the fact that Japan remains cheap versus its global peers despite the re-rating. Supportive fiscal and monetary policies and expectations of a reflationary environment have also underpinned the market. Since then, we have witnessed Japan equities break through to record highs in Q3 2024.
The rally, however, has mostly been driven by large cap stocks. See Fig 1. This is likely the result of index buying by various groups and investors shifting out of China. Japan’s small caps however have not moved in tandem. Globally, small caps have seen muted rises; small caps in the US have also lagged large caps since 20201.
In Japan, the current trade discount of small to large caps is at an extreme level. The last time such extreme widening took place in 2007/08. Subsequently there were 10 years of particularly good performance for small caps. Typically, as seen in the past 30 years, when the valuation cycle widens to this extreme, it tends to snap back.
Fig 1: Japan’s small caps lag in returns
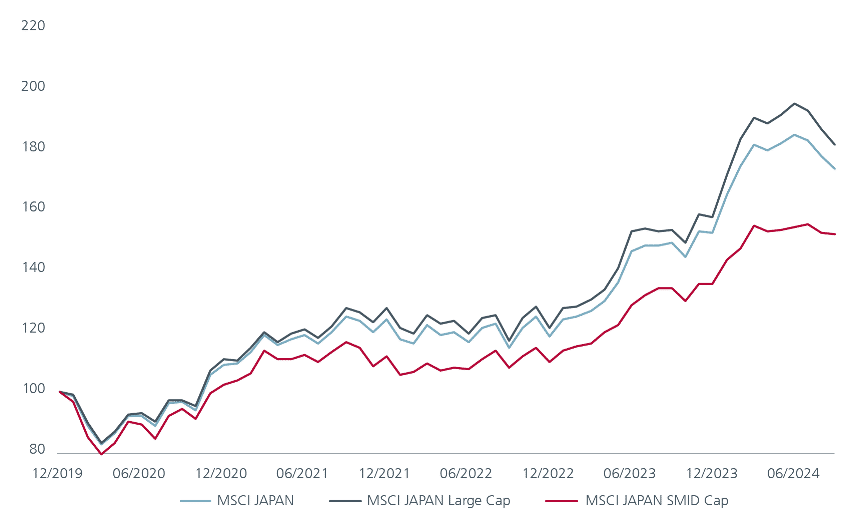
Source: MSCI indices as of 30 September 2024.
SMALL CAPS ARE THE LARGEST POTENTIAL BENEFICIARIES OF REFORMS
Unlike the large caps, the momentum has not taken off for Japan’s small to mid-caps (SMIDs). But once it does, it can offer equally attractive returns. We believe the impact of the Tokyo stock exchange (TSE) reforms will be a key trigger to unlock value in the SMIDs. Not only are there far more of them in terms of absolute numbers of companies in the small to mid-cap space compared to large caps, a higher proportion of SMID stocks are also trading below book compared to large caps. See Fig 2.
Fig 2: 40% of Japan’s SMIDs trade below book value (Price to book < 1 as a % of companies)
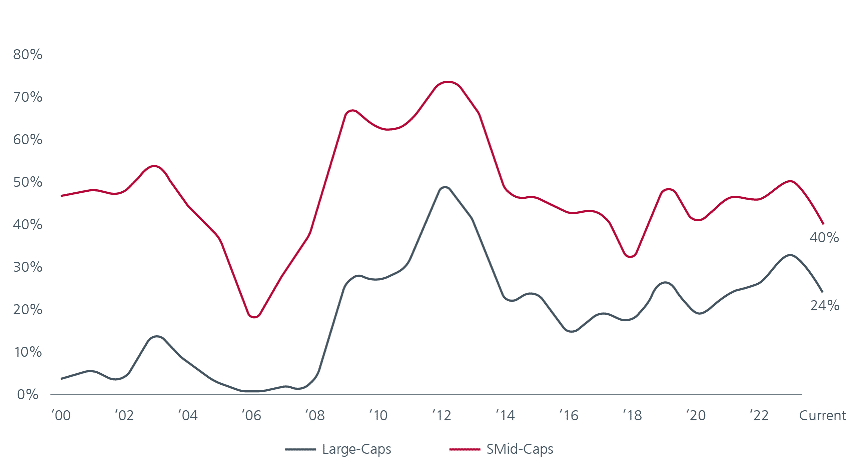
Source: Eastspring Investments, Japan large and small to mid-cap stocks data based on Bloomberg, LSEG Datastream, Factset, and J.P. Morgan calculations as of 30 September 2024. All yearly values are as of beginning of year.
Hundreds of SMIDs also have solid balance sheets, with some companies having as much as 70% of their market capitalisation consisting of net cash. Fig 3 indicates the breakdown in the various TOPIX market cap indices of the proportion of companies with a net cash position; 60% of the small caps have net cash on balance sheet compared to 41% in large caps. Furthermore, the net cash in small cap stocks with net cash is about 23% of the market value. This level of cash facilitates easy share buybacks, which in turn will improve the return on equity (ROE) and unlock value for shareholders.
Fig 3: Higher proportion of small cap companies with net cash
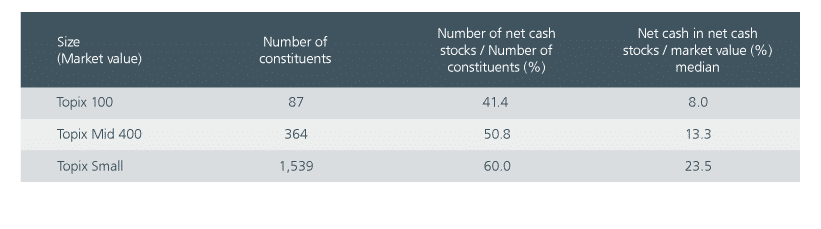
Source: Nomura. As of September 2024. Universe is TOPIX 100, TOPIX Mid 400, TOPIX Small.
TSE’s corporate governance reforms have already nudged many large cap companies to act to improve ROE, which has been reflected in their share price performance. See Fig 4. Within large caps, the group that disclosed outperformed by 10%, but the disparity has been even wider in the small and mid-cap spaces. With growing pressure to disclose, more SMIDs are expected to follow suit in the coming years.
Small caps’ attractive valuations, high net cash levels and share price performance disparity versus large caps are key reasons why we expect this group to be the largest potential beneficiaries of the TSE’s initiative. We are seeing record levels of share buybacks this year – twice the amount in the first nine months of 2024 relative to the same period in 2023 – and we expect this strong trend on balance sheet related reform to persist and include a wider cohort of companies.
Fig 4: Performance gap between the disclosed and undisclosed group
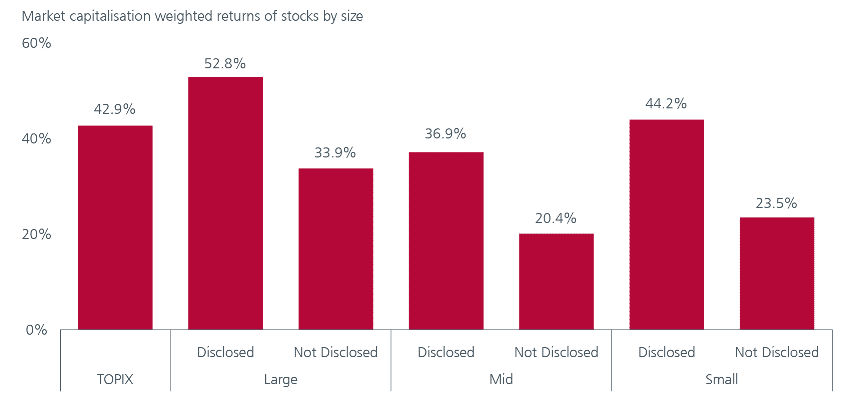
Source: Refinitiv, UBS. Performance is measured between end-2022 and 30 October 2024.
REFLATIONARY BACKDROP FAVOURS SMIDs
Investors have also become more optimistic about Japan’s economy on signs of healthy inflation in recent months. The Bank of Japan ended eight years of negative interest rate policy and raised the policy rate to +0.1% in March after the recent annual wage negotiations yielded the biggest pay hikes in 33 years. An inflationary environment means consumers and corporates with huge cash savings will be more incentivised to mobilise those into consumption and investment. In addition, the inflationary cycle should favour small caps more so than large caps as SMIDs tend to be more tied to the domestic economy.
That said, the SMID cap space consists of a diverse universe of stocks, with domestic and export-related companies distributed across a range of industries. See Fig 5. As such, an investor can enjoy diversification benefits by investing in SMID caps.
Another area that we believe will benefit Japanese corporates in general is the positive spillover benefits from Japan’s reshoring. Supply chain security and reshoring continues to be a key priority for the current government in view of Japan’ status as a global manufacturing powerhouse. Ultimately, measures to help companies reshore manufacturing bases will lift Japan’s economy, spur higher wages, and rekindle domestic consumption.
Fig 5: SMID cap wide and diverse investment universe

Source: Eastspring Investments, as of 30 September 2024. Sector weight for the Russell Nomura Mid-Small Cap, internal classification
ACTIVE INVESTING UNCOVERS ALPHA
The triggers are in place for the SMIDs to perform, but to reap the full benefits, an active investment approach works best. The SMID space is a prime market for longer term valuation-driven stock pickers. Although small-cap stocks represent over 80% of the Japan equity universe2 , they are often under researched. See Fig 6. The amount of sell-side analyst coverage is a good proxy for the market’s focus; within the TOPIX Small Index, over half of the names are being covered by 1 analyst at most.
We repeatedly see cases where smaller companies not only fall out of favour, often for shorter-term thematic reasons, but are also dropped from analyst coverage altogether. This drives mispricing to the sort of extremes where good or improving companies are simply ignored. Given that our investment process relies on exploiting persistent behavioural biases that cause significant dislocation between the share price and relative value of a company, this gives us a sustainable, strong edge on investing in companies that are likely beneficiaries ahead of the analyst’s recommendations.
Fig 6: Limited sell-side coverage for SMID cap stocks
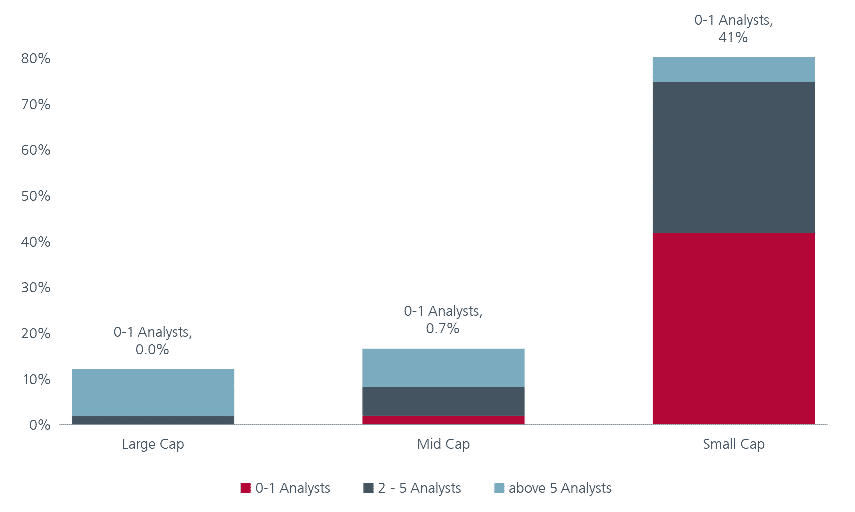
Source: Eastspring Investments, Nomura, based on IFIS and MSCI data, as of 30 September 2024. The universe data is based on the MSCI Japan Large Cap Index, MSCI Japan Mid Cap Index and MSCI Japan Small Cap Index
Within the SMID space, we see opportunities in undervalued regional banks and retailers. The former has a big domestic loan book and stand to benefit as rates edge up. Retailers will benefit as they pass on higher costs to more “cash-rich” consumers. In addition, we see value in stocks that have been sold off indiscriminately due to weak sentiment and cyclical weakness, including semiconductors and robotics. Meanwhile, we are under-allocated to defensive industries (e.g. health care, consumer staples) as we observe many names remain expensive relative to history and the market is overpaying for perceived shorter-term earnings certainty.
Interesting reads


Sources:
1 MSCI US Large Caps and MSCI US Small Caps as of 30 September 2024.
2 Defined by MSCI Japan market capitalization index suite as of 30 September 2024.
Singapore by Eastspring Investments (Singapore) Limited (UEN: 199407631H)
Australia (for wholesale clients only) by Eastspring Investments (Singapore) Limited (UEN: 199407631H), which is incorporated in Singapore, is exempt from the requirement to hold an Australian financial services licence and is licensed and regulated by the Monetary Authority of Singapore under Singapore laws which differ from Australian laws
Hong Kong by Eastspring Investments (Hong Kong) Limited and has not been reviewed by the Securities and Futures Commission of Hong Kong.
Indonesia by PT Eastspring Investments Indonesia, an investment manager that is licensed, registered and supervised by the Indonesia Financial Services Authority (OJK).
Malaysia by Eastspring Investments Berhad (200001028634/ 531241-U) and Eastspring Al-Wara’ Investments Berhad (200901017585 / 860682-K) and has not been reviewed by Securities Commission of Malaysia.
Thailand by Eastspring Asset Management (Thailand) Co., Ltd.
United States of America (for institutional clients only) by Eastspring Investments (Singapore) Limited (UEN: 199407631H), which is incorporated in Singapore and is registered with the U.S Securities and Exchange Commission as a registered investment adviser.
European Economic Area (for professional clients only) and Switzerland (for qualified investors only) by Eastspring Investments (Luxembourg) S.A., 26, Boulevard Royal, 2449 Luxembourg, Grand-Duchy of Luxembourg, registered with the Registre de Commerce et des Sociétés (Luxembourg), Register No B 173737.
Chile (for institutional clients only) by Eastspring Investments (Singapore) Limited (UEN: 199407631H), which is incorporated in Singapore and is licensed and regulated by the Monetary Authority of Singapore under Singapore laws which differ from Chilean laws.
The afore-mentioned entities are hereinafter collectively referred to as Eastspring Investments.
The views and opinions contained herein are those of the author, and may not necessarily represent views expressed or reflected in other Eastspring Investments’ communications. This document is solely for information purposes and does not have any regard to the specific investment objective, financial situation and/or particular needs of any specific persons who may receive this document. This document is not intended as an offer, a solicitation of offer or a recommendation, to deal in shares of securities or any financial instruments. It may not be published, circulated, reproduced or distributed without the prior written consent of Eastspring Investments. Reliance upon information in this document is at the sole discretion of the reader. Please carefully study the related information and/or consult your own professional adviser before investing.
Investment involves risks. Past performance of and the predictions, projections, or forecasts on the economy, securities markets or the economic trends of the markets are not necessarily indicative of the future or likely performance of Eastspring Investments or any of the funds managed by Eastspring Investments.
Information herein is believed to be reliable at time of publication. Data from third party sources may have been used in the preparation of this material and Eastspring Investments has not independently verified, validated or audited such data. Where lawfully permitted, Eastspring Investments does not warrant its completeness or accuracy and is not responsible for error of facts or opinion nor shall be liable for damages arising out of any person’s reliance upon this information. Any opinion or estimate contained in this document may subject to change without notice.
Eastspring Investments companies (excluding joint venture companies) are ultimately wholly owned/indirect subsidiaries of Prudential plc of the United Kingdom. Eastspring Investments companies (including joint venture companies) and Prudential plc are not affiliated in any manner with Prudential Financial, Inc., a company whose principal place of business is in the United States of America or with the Prudential Assurance Company Limited, a subsidiary of M&G plc (a company incorporated in the United Kingdom).