





Sep 2026|5 min read


Executive Summary
Emerging Market (EM) equities have outperformed Developed Market equities since the start of 2025, with the MSCI EM Index up more than 60%, almost double the returns of the MSCI World Index1. This outperformance has renewed investor interest in EM equities with more than USD100 bn of inflows year to date, however most of these flows have gone into passive funds. Fig. 1.
Fig. 1. Most flows into EM equities have gone into EM ETFs (USD bn)
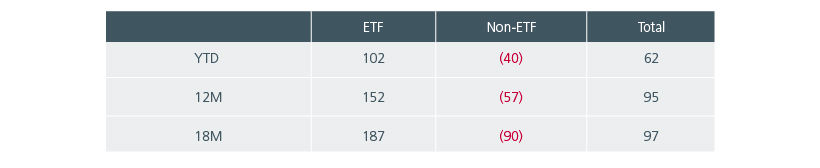
Source: JP Morgan, EPFR Global, Provisional data for August 2026.
This is despite EMs possessing numerous characteristics that position the region well for active investing. The Global EMs universe spans 24 countries and 3000 stocks – encompassing distinct regulatory regimes, corporate governance standards, liquidity profiles and investor bases. Analyst coverage of the GEMs universe is also less comprehensive compared to the developed markets. This means that there is greater scope for mispriced and stock-specific opportunities, allowing active managers to add value through fundamental research and active stock picking. In contrast, the deep liquidity conditions, broad analyst coverage and efficient information dissemination in the developed markets make it harder for active managers to uncover mispriced stocks. Fig. 2. These differences show up in the relative performances of passive funds that are invested in the US and EM equities. Fig 2 shows that over the last 10 years, passive funds tracking the S&P 500 Index have been able to deliver first or second quartile performances while passive funds tracking the MSCI EM Index have typically ranked in the third quartile.
Fig. 2. Performance of passive strategies against their benchmarks

Source: eVestment Peers Universe, Eastspring Investments, 30 June 2026. This is for information purposes only. It is not intended as an offer or solicitation for the purchase or sale of any financial instrument, investment product, security or service. Past performance is not necessarily indicative of the future or likely performance.
EMs’ heterogeneity and wide return dispersion create more opportunities for active investors to generate alpha through active stock selection. Against a backdrop of rising geopolitical fragmentation and uneven economic growth going forward, active investing is likely to make a bigger impact on portfolio outcomes.
The risk of passive investing in EMs
Besides potentially missing out on attractive mispriced or off-benchmark opportunities, the strong performances in selected EMs in the last few years expose passive investors to rising concentration risks. Following the AI-fueled rallies in Taiwan and South Korea, Taiwan’s and South Korea’s market capitalisations have risen, amounting to over 50% of the MSCI EM Index at end June 2026, up from 37% in January 2025. At the same time, the market capitalisations of these two markets are becoming dominated by a handful of mega-cap technology companies.
Fig. 3 shows that Taiwan and Korea each have around 80-85 stocks in the MSCI EM Index, but they make up 27% and 22% of the index respectively. On the other hand, China with 5 to 6x more stocks than Taiwan makes up 22% of the index. Similarly, India with 180 stocks account for 11% of the MSCI EM index. Compared to Taiwan and Korea, both China’s and India’s weight is spread across more companies. As such, passive investors that track the MSCI EM index are not getting broad exposures to Taiwan and Korea but are instead getting exposure to a few mega-cap technology companies.
Fig. 3. MSCI Emerging Markets - Market weight vs stock count in each market
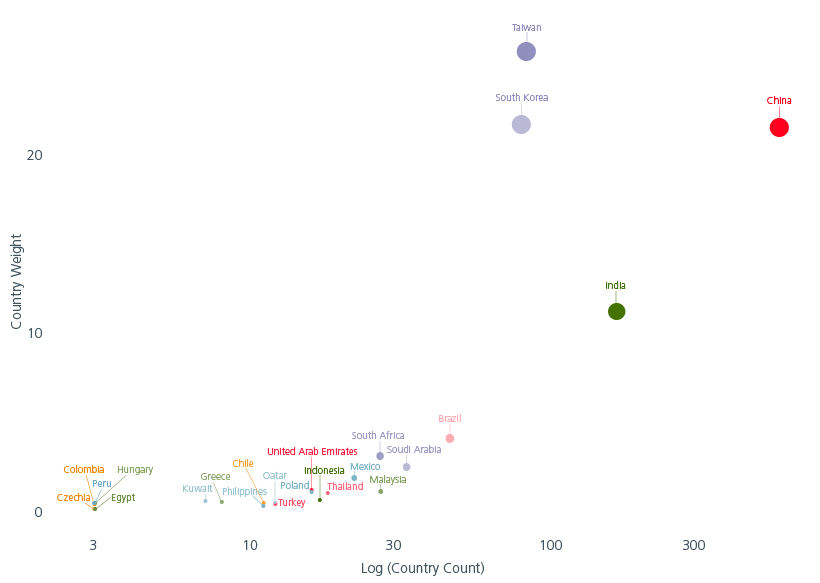
Source: Portfolio Research and Analytics, Eastspring Investments, as at 29 May 2026. The use of indices as proxies for the past performance of any asset class/sector is limited and should not be construed as being indicative of the future or likely performance of the portfolio.
The rise of the Magnificent Seven and AI-related giants in the US has raised investor concern over the rising stock and sector concentration risks in the S&P500 Index. The same concerns now appear to be emerging in the EMs with the Information Technology (IT) sector now accounting for 41% at end July 2026. Within the EMs, concentration risk is potentially even more pronounced in growth-oriented benchmarks like the MSCI EM Growth Index, where the IT sector weight sat at 47% at end July 2026, or growth-biased strategies. Given their affinity for companies with stronger growth characteristics, growth-biased strategies are likely to have a natural tilt towards semiconductors, AI beneficiaries and technology hardware in the current environment. This potentially results in elevated concentration risks on the stock, country and sector levels.
A closely associated impact of the concentration of EMs in a few names, has been the narrow breadth of the market. Fig 4. We are now seeing the ‘narrowest’ market in almost 25 years in EMs. As fewer stocks outperform, this narrow momentum leads to very stretched valuations in a few expensive stocks and sectors which are at danger of subsequent corrections, emphasising the importance of active investing.
Fig. 4. Percentage of constituents outperforming MSCI EM Index on year-on-year basis (USD terms)
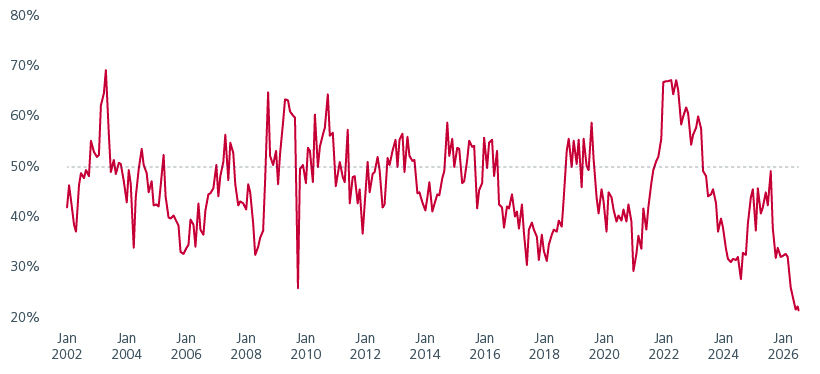
Source: HSBC. As at 14 August 2026.
Embrace value’s greater differentiation
The attractiveness of a GEM value strategy is even more pronounced today. Given the focus on valuations, company fundamentals and cashflows, a value approach is likely to provide investors with greater diversification. The valuation gap between the most expensive and cheapest stocks within EMs is currently significantly above historical averages. Fig. 5. This reflects investors’ current strong preference for a narrow group of growth and AI-related winners over cyclical and value-oriented business such as banks, energy and domestic cyclicals. These conditions create fertile conditions for active value investors as valuations normalise and market leadership broadens.
Fig. 5. The valuation dispersion in Global Emerging Markets is significantly above historical averages
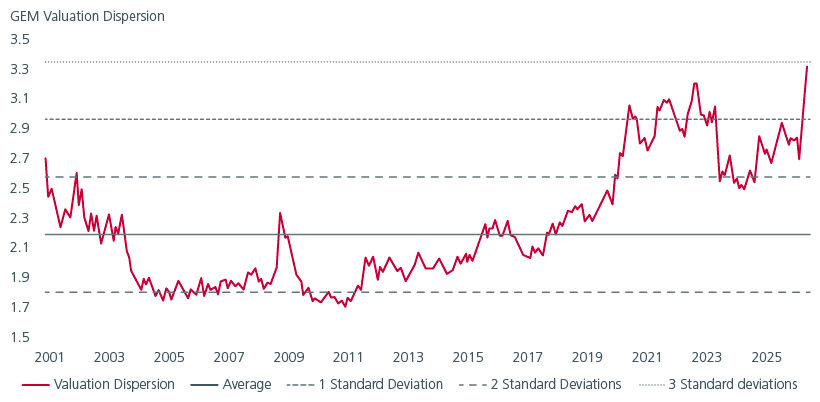
Source: Eastspring Investments, 30 June 2026. Valuation dispersion is defined as the Forward 12 month price to earnings ratio of the 25% most expensive stocks in the research universe divided by the forward 12 month price to earnings ratio of the 25% least expensive stocks in the research universe. The research universe is defined as the top 95% by market capitalisation of the S&P Emerging BMI plus Korea.
At the same time, history suggests that rising interest rates tend to be more supportive of value strategies. A resilient US economy combined with inflation pressures is driving market expectations for interest rate increases in the future. Compared to growth companies, value companies are shorter duration assets as they generate most of their cashflows and earnings sooner and are therefore less sensitive to interest rate changes.
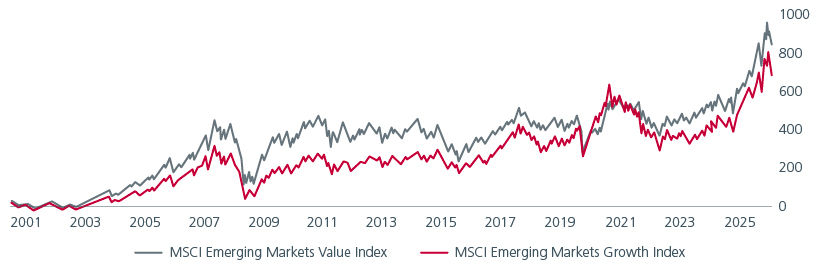
Historically, value strategies have outperformed growth strategies over the long term as value strategies buy stocks that are priced below their intrinsic values, and benefit when these valuations normalise. The dividends from mature, cash-generative value companies also contributed to long-term total returns. Fig. 6.
Fig. 6. EM Value outperforms EM Growth over the long term
Source: Bloomberg, Eastspring Investments, as at 31 July 2026. The use of indices as proxies for the past performance of any asset class/sector is limited and should not be construed as being indicative of the future or likely performance of the portfolio.
The case for an active value approach
For investors already invested in, or seeking exposure to EM equities, the rising concentration in the MSCI EM Index strengthens the case for a more active approach. Today’s benchmarks increasingly reflect a narrower opportunity set, dominated by selected countries, sectors and mega-cap technology names. Active managers can look beyond benchmark weights to identify mispriced opportunities, manage concentration risk and respond more dynamically to shifts in macro, geopolitical and market conditions.
Within this context, a GEM value strategy can offer meaningful differentiation from passive and growth-biased approaches. Its focus on valuations, cashflows and fundamentals provides exposure to a different set of return drivers at a time when parts of the market appear expensive and increasingly crowded.
With markets likely to be volatile, careful stock selection and rigorous due diligence will matter more. A disciplined value approach, anchored in fundamentals and valuations may be well-placed to capture overlooked opportunities while helping investors navigate a more uneven EM landscape.
Interesting reads











Sources:
1Bloomberg. 31 Dec 2024 – 30 June 2026. In USD terms.
Singapore by Eastspring Investments (Singapore) Limited (UEN: 199407631H)
Australia (for wholesale clients only) by Eastspring Investments (Singapore) Limited (UEN: 199407631H), which is incorporated in Singapore, is exempt from the requirement to hold an Australian financial services licence and is licensed and regulated by the Monetary Authority of Singapore under Singapore laws which differ from Australian laws
Hong Kong by Eastspring Investments (Hong Kong) Limited and has not been reviewed by the Securities and Futures Commission of Hong Kong.
Indonesia by PT Eastspring Investments Indonesia, an investment manager that is licensed, registered and supervised by the Indonesia Financial Services Authority (OJK).
Malaysia by Eastspring Investments Berhad (200001028634/ 531241-U) and Eastspring Al-Wara’ Investments Berhad (200901017585 / 860682-K) and has not been reviewed by Securities Commission of Malaysia.
Thailand by Eastspring Asset Management (Thailand) Co., Ltd.
United States of America (for institutional clients only) by Eastspring Investments (Singapore) Limited (UEN: 199407631H), which is incorporated in Singapore and is registered with the U.S Securities and Exchange Commission as a registered investment adviser.
European Economic Area (for professional clients only) and Switzerland (for qualified investors only) by Eastspring Investments (Luxembourg) S.A., 26, Boulevard Royal, 2449 Luxembourg, Grand-Duchy of Luxembourg, registered with the Registre de Commerce et des Sociétés (Luxembourg), Register No B 173737.
Chile (for institutional clients only) by Eastspring Investments (Singapore) Limited (UEN: 199407631H), which is incorporated in Singapore and is licensed and regulated by the Monetary Authority of Singapore under Singapore laws which differ from Chilean laws.
The afore-mentioned entities are hereinafter collectively referred to as Eastspring Investments.
The views and opinions contained herein are those of the author, and may not necessarily represent views expressed or reflected in other Eastspring Investments’ communications. This document is solely for information purposes and does not have any regard to the specific investment objective, financial situation and/or particular needs of any specific persons who may receive this document. This document is not intended as an offer, a solicitation of offer or a recommendation, to deal in shares of securities or any financial instruments. It may not be published, circulated, reproduced or distributed without the prior written consent of Eastspring Investments. Reliance upon information in this document is at the sole discretion of the reader. Please carefully study the related information and/or consult your own professional adviser before investing.
Investment involves risks. Past performance of and the predictions, projections, or forecasts on the economy, securities markets or the economic trends of the markets are not necessarily indicative of the future or likely performance of Eastspring Investments or any of the funds managed by Eastspring Investments.
Information herein is believed to be reliable at time of publication. Data from third party sources may have been used in the preparation of this material and Eastspring Investments has not independently verified, validated or audited such data. Where lawfully permitted, Eastspring Investments does not warrant its completeness or accuracy and is not responsible for error of facts or opinion nor shall be liable for damages arising out of any person’s reliance upon this information. Any opinion or estimate contained in this document may subject to change without notice.
Eastspring Investments companies (excluding joint venture companies) are ultimately wholly owned/indirect subsidiaries of Prudential plc of the United Kingdom. Eastspring Investments companies (including joint venture companies) and Prudential plc are not affiliated in any manner with Prudential Financial, Inc., a company whose principal place of business is in the United States of America or with the Prudential Assurance Company Limited, a subsidiary of M&G plc (a company incorporated in the United Kingdom).