







Sep 2026|5 min read



Executive Summary
Emerging Market Debt (EMD) has evolved from a niche allocation into a large, diverse and increasingly resilient fixed income universe. Its recent performance, improving credit quality and differentiated return drivers suggest that investors may need to rethink long-standing assumptions about the asset class. As macro conditions become more fragmented, EMD may offer investors a differentiated source of total return and greater portfolio diversification.
Competitive returns with stronger risk-adjusted outcomes
Sovereign USD EMD, as represented by the JPM EMBI Global Diversified (EMBIGD) Index, has outperformed both US and European investment grade (IG)/ high yield (HY) blended bond portfolios over the 1-, 3-, 5- and 20-year horizons on a total return basis. The blended portfolios have similar credit-quality profiles - the EMBIGD Index comprises both investment grade (IG) and high yield (HY) sovereign bonds, while the US and European blended bond portfolios also combine both IG and HY bonds from their respective markets.
Compared to the US and European blended bond portfolios, EMD delivered superior risk-adjusted returns over the 1- and 3-year horizons, with Sharpe ratios of 1.61 and 1.22 respectively, supported by EMD’s higher returns and lower volatility. Fig.1.
Fig 1: Annualized total returns, volatility and Sharpe ratios across various time horizons
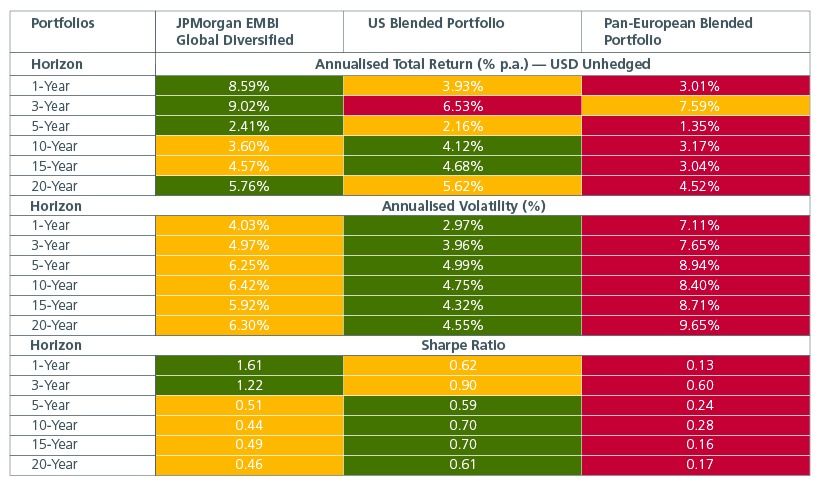
Source: Eastspring Investments, Bloomberg, in USD terms, as of 31 July 2026. The JPM EMBI Global Diversified index (JPEIDIVR) has 47.22% in IG bonds and 52.78% in HY bonds. For fairer comparison, we constructed US IG/ HY blended and Pan-European
IG/ HY blended portfolios which also have compositions of 47.22% IG and 52.78% HY bonds.
Returns are annualised arithmetic mean simple daily returns scaled by 252 trading days. Annualised volatility is the standard deviation of simple
daily returns scaled by √252. Blended daily returns are computed as the weighted sum of component simple daily returns.
Sharpe ratios use the geometric CAGR of the J.P. Morgan GBI US Government Bond Total Return Index (JPMTUS Index)
over each respective horizon as the risk-free rate.
All figures are in USD unhedged terms; European index returns reflect EUR/USD currency effects.
The case for EMD as a strategic bond allocation becomes even more compelling when evaluated as a complement to developed market (DM) bond portfolios. Our analysis based on 5 years of data shows that adding a 10% allocation of EMD to a blended US (50% IG/ 50% HY) and a blended European (50% IG/50% HY) bond portfolio improves the portfolio’s overall risk-adjusted returns, as measured by the Sharpe ratio. Fig. 2. Yet, many investors remain under allocated to EMD given lingering risk perceptions.
Fig 2: Adding EMD to blended bond portfolios can improve risk-return outcomes
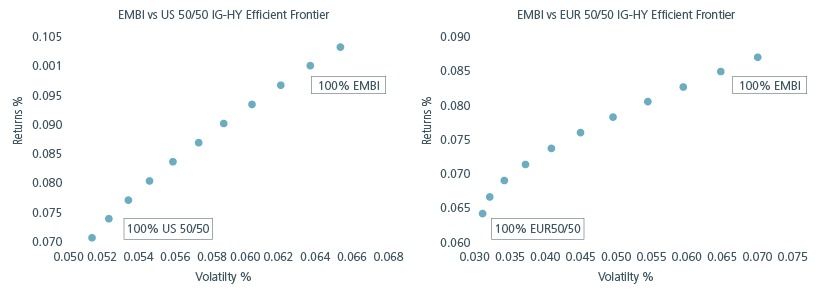
Source: Bloomberg, as of August 2026. Indices used include the JPM EMBI Global Diversified Index, the Bloomberg Pan-European HY Index, the Bloomberg Euro Corporate Bond Index, the Bloomberg U.S. Corporate High Yield Bond Index and the Bloomberg U.S. Corporate Bond Index.
From niche allocation to strategic bond market
EMD is no longer the narrow distressed-debt niche of the 1990s. It is broader, higher quality and more investable than many investors assume. As of December 2025, total Global EM tradable debt amounted to USD52tn or ~31% of global bonds outstanding, slightly behind the US, and ahead of the European Union. Fig. 3.
Fig 3: Emerging Market Debt has grown into a USD52tn bond market as of December 2025
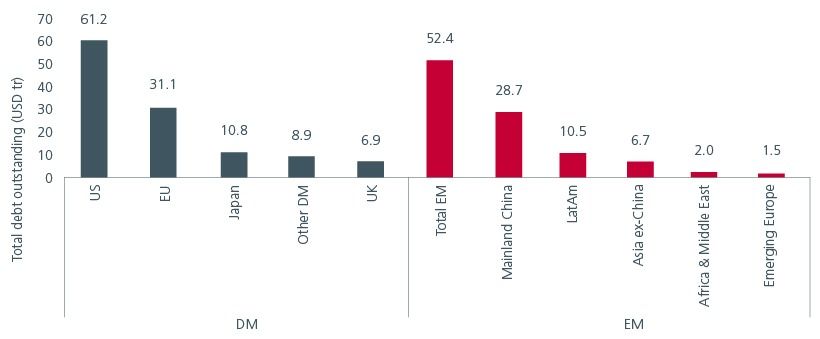
Source: Eastspring Investments, Bank of International Settlement (BIS), data as of 31 December 2025. Data portal assessed 30/7/2026.
EMs is a powerful engine of global growth. By 2031, the International Monetary Fund (IMF) expects EMs to account for almost 75% of nominal global growth. Fig. 4. As EM economies continue to grow faster than developed markets, their economic importance and relevance within global portfolios is likely to increase. A broader and deeper EMD universe gives global bond investors more ways to access EM growth and income.
Fig 4: EMs are expected to account for almost 75% of nominal global growth
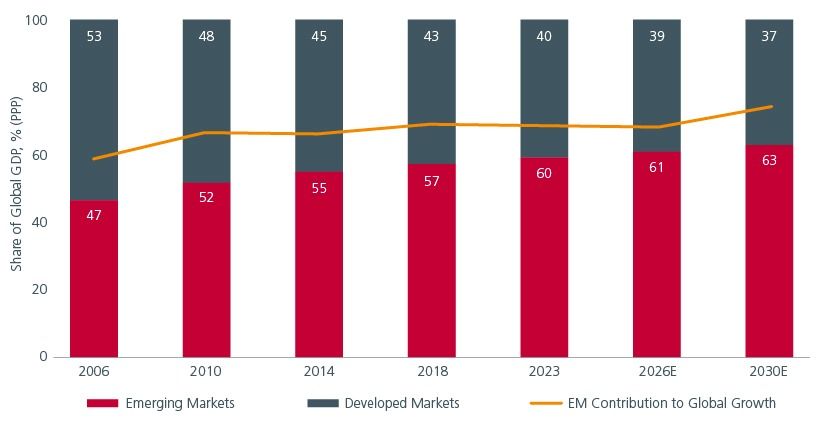
Source: IMF World Economic Outlook, April 2026, semi-annual update (latest available). Any projection or forecast is not necessarily indicative of the future or likely performance. GDP shares are based on purchasing power parity (PPP) GDP levels. Contribution to global growth is derived from year on year changes in nominal GDP levels. Global recession years (2009 and 2020) are excluded, as growth contribution measures are not meaningful when global GDP contracts.
EMD has become more resilient
While investors have traditionally looked to DMs and DM bonds for greater stability, EMs have spent the past three decades strengthening their market structures, institutions and ability to manage crises. The growing resilience of the EM economies can be seen from the shift in bond credit quality - the percentage of IG-rated USD denominated EM sovereign bonds rose to above 50% in 2025 up from 0% in 1991. Fig. 5.
Fig 5: More USD EM sovereign debt is becoming investment grade

Source: Eastspring Investments (Singapore) Limited, JPMorgan, 31 July 2026. Above reflects the JPMorgan Emerging Markets Bond Index - Global Diversified Index. Due to rounding, numbers presented may not add up precisely to the totals indicated and percentages may not reflect the absolute figures for the same reason. Any credit ratings are solely statements of opinion of the credit rating agency, are not statements of fact and do not constitute investment recommendations or advice.
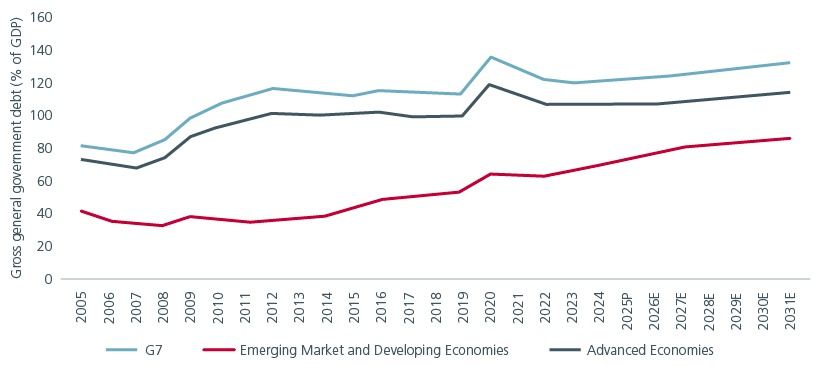
Over the past years, several large EM central banks have lowered/narrowed their inflation target ranges resulting in greater currency stability and more attractive local debt markets. By contrast, inflation in several developed markets remains above target, while larger fiscal needs and structurally higher social spending may challenge the path back to sustainably lower inflation. The IMF forecasts DM’s share of gross government debt to Gross Domestic Product (GDP) to reach 114% by 2031, above the EM’s 86%. See Fig. 6. Long-term bond yields in the US, France, UK and Japan have risen, driven by concerns over their economies’ long-term fiscal sustainability.
Fig 6: EMs are expected to be less indebted than DMs
Source: Eastspring Investments, IMF World Economic Outlook, April 2026.
EM issuers have also increasingly diversified their funding currencies beyond their domestic currencies and the USD, to include CNY, CNH, AUD and JPY. This potentially reduces costs and their reliance on a single funding market, making the EMD universe more resilient.
A broader opportunity set with diversification benefits
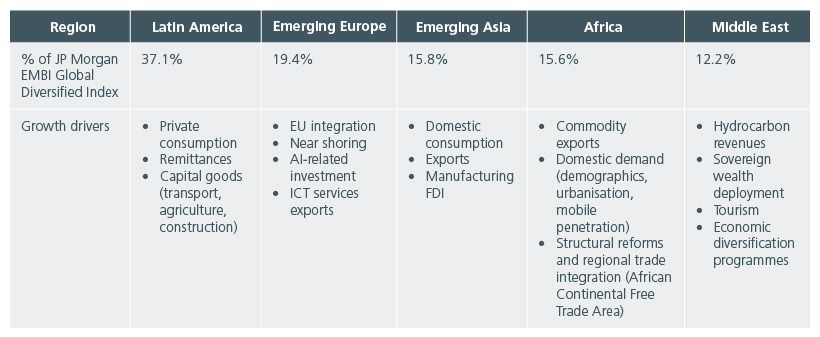
The EMs offer a rich opportunity set consisting of over 70 countries that are highly diverse in terms of economic structure, demographics and stages of development. Fig. 7. This diversity creates economic and policy dispersion which presents opportunities for active managers.
Fig 7: EMD offers investors access to EM’s diverse growth drivers
Source: Eastspring Investments. World Bank. IMF. Share of EMBIGD as of 31 July 2026. JP Morgan.
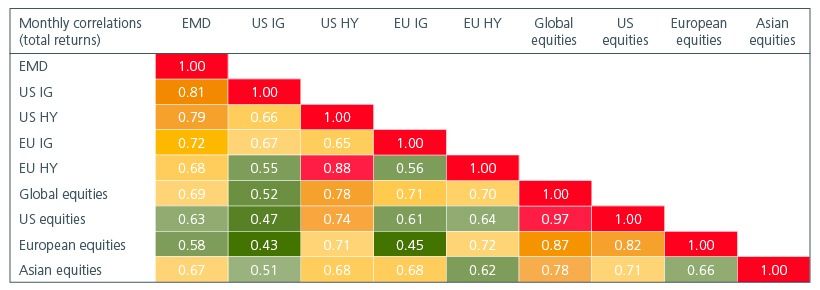
Given EM’s diverse economic drivers, EMD’s return profile can differ from traditional DM bond and equity exposures. EMD has a relatively low correlation with US Treasuries at 0.32, providing bond investors with diversification benefits. In addition, while EMD is affected by global risk sentiment, it is less correlated to global, US and European equities than US and European HY bonds. Fig. 8.
Fig 8: EMD has a lower correlation to global, US and European equities
Source: Monthly correlations (total returns) – Jan 2006 – June 2026. Bloomberg. Eastspring Investments. JP Morgan EMBI Global Diversified Composite. Bloomberg US Corporate Bond Index. Bloomberg US Corporate High Yield Bond Index. Bloomberg Pan-European Aggregate Corporate Index. Bloomberg Pan-European High Yield Index. MSCI World. S&P 500 Index. MSCI Europe Index. MSCI AC Asia ex Japan Index.
Why EMD now
The case for EMD is stronger today because global macro conditions are becoming more fragmented. Artificial Intelligence (AI) disruption, geopolitical tensions, shifting trade alliances and energy security concerns are creating greater dispersion across growth, inflation, policy rates and currencies within the EMs. For active investors, this dispersion creates multiple opportunities.
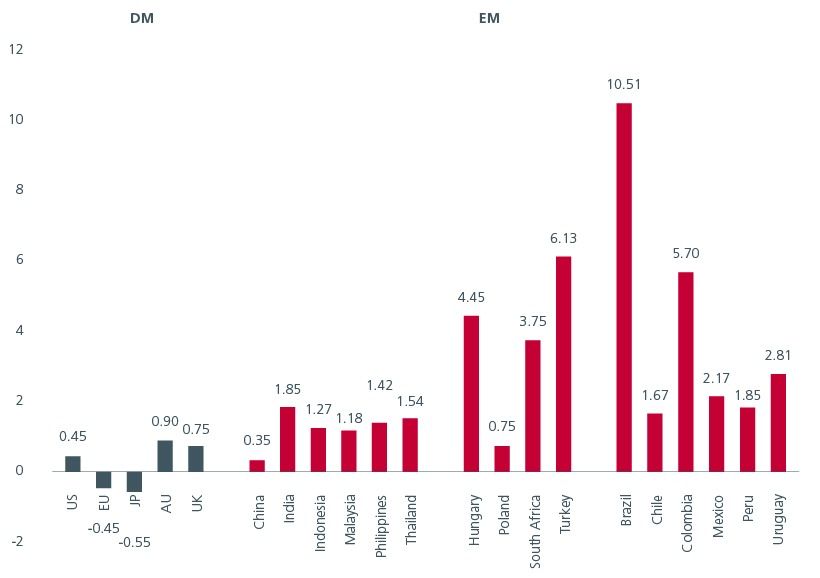
Valuations also remain supportive in selected markets. Despite recent turbulence in the Middle East and higher global bond yields, real rates are still attractive in parts of Central and Eastern Europe, Middle East and Africa (CEEMEA) as well as in Latin America. Fig. 9.
Fig 9: Real policy rates in CEEMEA and Latin America continue to offer value
Source: Eastspring Investments (Singapore), Bloomberg, Apr 2026. Any projection or forecast is not necessarily indicative of the future or likely performance.
With macro dispersion rising globally and return drivers becoming more differentiated, the risk for global bond investors may no longer be simply whether to allocate to EMD, but whether staying under-allocated could mean missing a more resilient, diversified and increasingly relevant source of total returns.
Interesting reads










Sources:
1Morgan Stanley, August 2026
2Nomura report on Asia AI Semi & Server, 30 June 2026
Singapore by Eastspring Investments (Singapore) Limited (UEN: 199407631H)
Australia (for wholesale clients only) by Eastspring Investments (Singapore) Limited (UEN: 199407631H), which is incorporated in Singapore, is exempt from the requirement to hold an Australian financial services licence and is licensed and regulated by the Monetary Authority of Singapore under Singapore laws which differ from Australian laws
Hong Kong by Eastspring Investments (Hong Kong) Limited and has not been reviewed by the Securities and Futures Commission of Hong Kong.
Indonesia by PT Eastspring Investments Indonesia, an investment manager that is licensed, registered and supervised by the Indonesia Financial Services Authority (OJK).
Malaysia by Eastspring Investments Berhad (200001028634/ 531241-U) and Eastspring Al-Wara’ Investments Berhad (200901017585 / 860682-K) and has not been reviewed by Securities Commission of Malaysia.
Thailand by Eastspring Asset Management (Thailand) Co., Ltd.
United States of America (for institutional clients only) by Eastspring Investments (Singapore) Limited (UEN: 199407631H), which is incorporated in Singapore and is registered with the U.S Securities and Exchange Commission as a registered investment adviser.
European Economic Area (for professional clients only) and Switzerland (for qualified investors only) by Eastspring Investments (Luxembourg) S.A., 26, Boulevard Royal, 2449 Luxembourg, Grand-Duchy of Luxembourg, registered with the Registre de Commerce et des Sociétés (Luxembourg), Register No B 173737.
Chile (for institutional clients only) by Eastspring Investments (Singapore) Limited (UEN: 199407631H), which is incorporated in Singapore and is licensed and regulated by the Monetary Authority of Singapore under Singapore laws which differ from Chilean laws.
The afore-mentioned entities are hereinafter collectively referred to as Eastspring Investments.
The views and opinions contained herein are those of the author, and may not necessarily represent views expressed or reflected in other Eastspring Investments’ communications. This document is solely for information purposes and does not have any regard to the specific investment objective, financial situation and/or particular needs of any specific persons who may receive this document. This document is not intended as an offer, a solicitation of offer or a recommendation, to deal in shares of securities or any financial instruments. It may not be published, circulated, reproduced or distributed without the prior written consent of Eastspring Investments. Reliance upon information in this document is at the sole discretion of the reader. Please carefully study the related information and/or consult your own professional adviser before investing.
Investment involves risks. Past performance of and the predictions, projections, or forecasts on the economy, securities markets or the economic trends of the markets are not necessarily indicative of the future or likely performance of Eastspring Investments or any of the funds managed by Eastspring Investments.
Information herein is believed to be reliable at time of publication. Data from third party sources may have been used in the preparation of this material and Eastspring Investments has not independently verified, validated or audited such data. Where lawfully permitted, Eastspring Investments does not warrant its completeness or accuracy and is not responsible for error of facts or opinion nor shall be liable for damages arising out of any person’s reliance upon this information. Any opinion or estimate contained in this document may subject to change without notice.
Eastspring Investments companies (excluding joint venture companies) are ultimately wholly owned/indirect subsidiaries of Prudential plc of the United Kingdom. Eastspring Investments companies (including joint venture companies) and Prudential plc are not affiliated in any manner with Prudential Financial, Inc., a company whose principal place of business is in the United States of America or with the Prudential Assurance Company Limited, a subsidiary of M&G plc (a company incorporated in the United Kingdom).
