


Summary
Initial public offerings and share placements continue to appeal as funding options for companies in Asia Pacific. Equally, new growth sectors, increasing populations, and market reforms will serve to underpin the region’s momentum in deal flows.
Equity capital markets play a critical role in a country’s economic development. As of June 2023, the US equity market is the largest by market capitalisation globally, with a 43% share, followed by Europe (11%), China (~11%) and Japan (5%)1
In Asia, as the region’s economies developed and expanded over time, so too have their capital markets; in 2010, total capitalisation across key Asian markets was nearly USD15 trillion, which doubled to USD30 trillion by 2022. Fig 1. More importantly, proceeds from Asia Pacific’s Initial Public Offerings (“IPOs”) also exceeded the Americas in 2022, the first time since 2018, with 802 IPOs raising USD108 billion. But with Asia expected to account for over 40% of the world’s GDP by 20302, the region’s capital markets need to expand and develop further to facilitate long-term growth.
Fig 1: Asian markets’ capitalisation
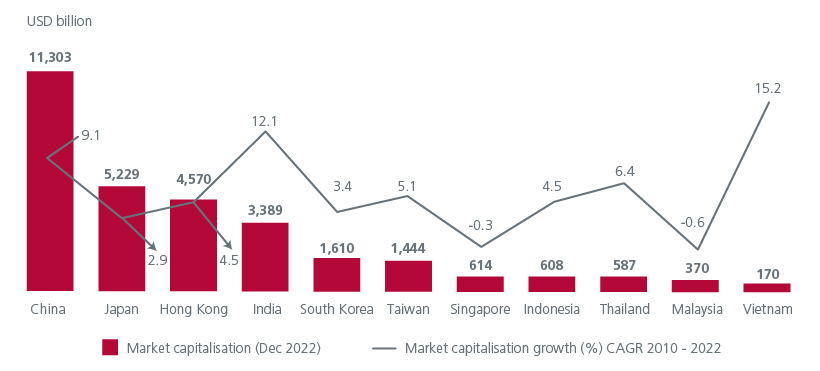
Source: CEIC, NSE Dec 2022
Asia Pacific maintains its IPO lead
Despite accounting for less than 20% of the MSCI All Country World index, Asia Pacific makes up the majority of global IPOs. Fig 2. Between 2007 and 2022, there have been over 1,180 IPOs. As at 1H2023, Asia Pacific continues to be the global leader in IPO volume and value, but uncertainty over interest rates and economic conditions resulted in a 2% decrease in the number of IPOs compared to 1H2022. Still half of the top ten global IPOs were from Mainland China, and one was from Japan. In terms of sectors, technology, industrials, and materials were the major issuers.3
Fig 2: Asia’s share of global IPOs
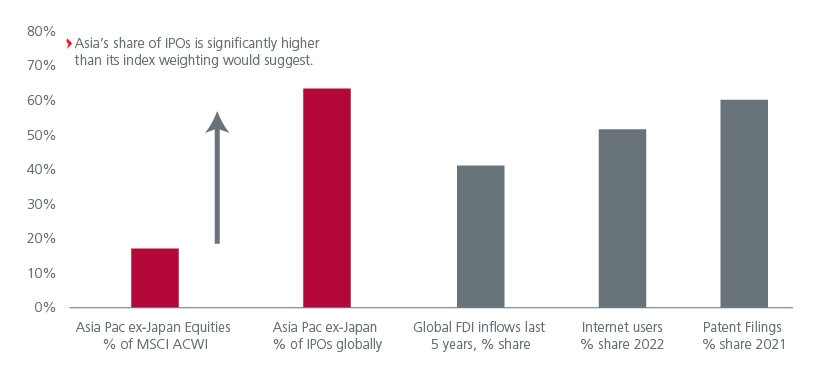
Source: Eastspring Investments (Singapore) Limited; All data refer to Asia Pacific ex Japan region as a % share; MSCI ACWI Index is a global equity index designed by MSCI to represent the full set of large and mid-cap stocks across 23 developed and 24 emerging markets, data as of 31st Dec 2022; IPO data from JP Morgan for 2022; World Bank FDI inflow data from 2017 to 2021; Internet user data from Statista for 2022; “WIPO World Intellectual Property Indicators 2022”, data for patent filings in 2021.
Meanwhile India recorded 80 new IPO listings, driven by small and medium enterprises coming to the market, an increase of 33% over 1H2022. India has continued to increase its global IPO share and currently commands roughly 13% of the market. Interestingly, ASEAN has seen a pickup in activity as well, recording more IPOs in the first half of 2023 than in any of the previous five years. Indonesia has been a star performer, especially with the materials sector, which is focused on the green energy transition, being at the forefront of market activity.
It is vital to note that the Asia Pacific ex-Japan region has seen a continuous deal flow for IPOs through various economic cycles, offering investors exposure to a good mix of sectors and countries throughout. Fig 3. In addition, even in the years with fewer IPO deals, there has been a continuous flow of follow-on offerings and blocks.
Fig 3: IPO opportunities through good and bad times
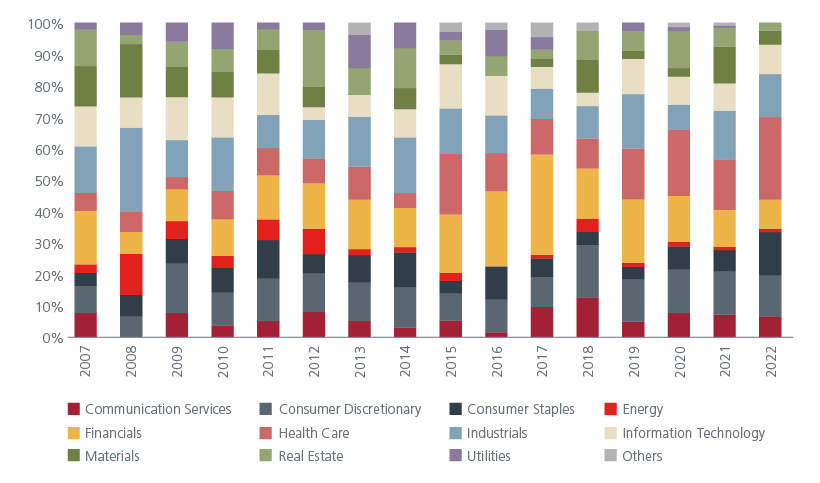
Source: Eastspring Investments (Singapore) Limited. IPO Data from 1 January 2007 to 31st December 2022 using the using Bloomberg data. Chinese A-share IPOs are excluded given market access limitations via Stock Connect for initial public offerings. Only IPOs with at least USD 500 million market capitalization and USD 0.8 million USD 3-month average daily value traded are included in the data
Share placements offer another avenue
While IPOs are considered significant events for both corporates and investors to gain access to equity capital markets, placements offer similar access opportunities. For example, a publicly listed company can turn to the market via follow-on offerings when in need of primary capital to finance investments. Block trades are also conducted by large institutional investors to acquire or dispose of shares in listed companies, and these trades can often come at attractive discounts.
Between 2007 and 2022, there have been an average of 309 follow-ons and blocks. Fig 4. Irrespective of market cycles, the market for these deals again has seen a continuous flow, ranging from a low of 105 placements in 2008 to a peak of 491 placements in 2021.
Fig 4: Number of follow-ons and blocks

Source: Eastspring Investments (Singapore) Limited. Data regarding follow-ons and blocks from Dealogic database up until 31st December 2022, transactions from 1 Jan 2007 to until 31st December 2022. Follow-ons includes Primary Offerings such as Equity follow-ons, Rights Offerings and Topups. Blocks includes Secondary sell downs by existing shareholders (by hiring a third-party intermediary like an investment bank and launching a block sale process with a term sheet to the market). Data is screened for Asia Pacific ex Japan universe.
The growing market of retail investors
The increased participation of retail investors is another trend that has been ongoing for a while, thanks in part to the introduction of financial technology solutions. Online investment platforms, robo-advisors, and other digital innovations are enabling retail investors easier access to trade and participate in more markets. The retail investors of today often take greater ownership of their financial affairs and are motivated to grow their wealth to meet their own financial goals. Rising affluence is yet another factor fuelling the retail investing trend, and Asia’s growing middle class supports this development.
Historically, IPOs have also appealed to the retail investor for its alpha generation potential. Our analysis shows that IPOs historically demonstrate positive excess returns over the market. Analysis around the “first day IPO pop” shows consistent positive first-day excess returns going back 15 years. Fig 5. We see a similar phenomenon when looking at longer-term excess returns from participating in IPOs for the same markets. One thing to take note is that retail investors usually cannot directly participate in IPOs in markets outside of their home country. One way around this is to invest in mutual funds that have access to equity capital market events across geographies.
Fig 5: First-day index-adjusted* returns by year for IPOs
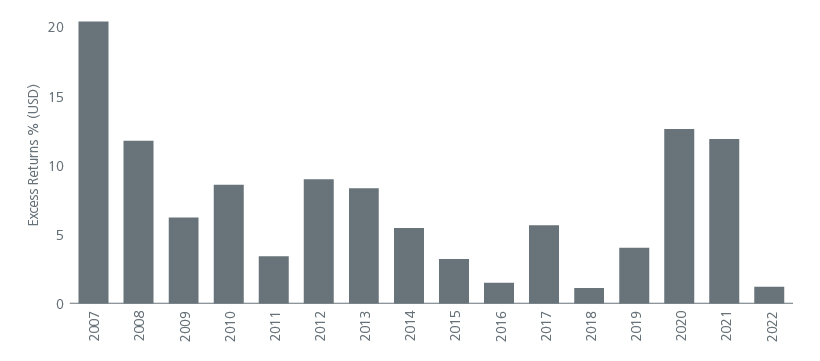
Source: Eastspring Investments (Singapore) Limited. IPO: initial public offering. *IPO Data from 1 January 2007 to 31st December 2022. Chinese A-share IPOs are excluded given market access limitations via Stock Connect for initial public offerings. Index used is the MSCI Asia Pacific ex Japan Index. The returns shown are index adjusted median returns using Bloomberg Data, screened for companies with at least $500m market capitalization at listing. Past IPO returns are not necessarily indicative of future returns.
The region’s long-term potential
Asia remains a high growth region led by two of its largest emerging economies, China and India. Rapid economic progress has resulted in both countries having their weights raised in the regional indices. This trend is expected to continue in the medium term, driven by further A-share inclusion (China) and more equity capital market deals in both markets.
Besides these two giants, other countries in the region also possess attractive growth traits that will be supportive of more deal activity. For example, the region’s increasingly urban and middle-class consumer will spur more IPOs in sectors related to consumer demand i.e., digital infrastructure, technology, and fintech. Meanwhile climate change is hastening the move to renewables. The energy transition is creating huge disruptions in some sectors, resulting in new business opportunities. In fact, Indonesia’s star IPO performance to date is driven by its ample battery metal reserves which are critical for electric vehicles.
There is also the trend of companies adopting the China plus one strategy in the wake of COVID-19 supply chain disruptions and ongoing geopolitical tensions. ASEAN and India are clear beneficiaries, and this shift is expected to further underpin the region’s growth.
Supportive backdrop bodes well
Some of the key reasons for choosing to list and trade on an exchange include costs, liquidity, and listing rules. To this end, Asian bourses have in recent times implemented supportive policies to facilitate both issuer and investor market access. India’s capital markets regulator has recently proposed to reduce timelines for IPOs from six days to three days. Likewise, China has relaxed the rules for IPO listings which should speed up listings and corporate fundraising. The Hong Kong and Beijing bourses also recently agreed to let qualified companies apply for a dual listing on each other’s bourses.
Looking ahead, the region’s capital expenditure needs are rising given population growth, climate change investments, and the re-routing of global supply chain ecosystems. The capex boom will invariably result in more equity capital market deals. The region’s financial markets will play a vital role in financing these needs and allocating capital to productive projects. And with investors anticipating the end of rate hikes, conditions should become conducive for a more buoyant market with ample primary and secondary offerings in the years ahead.
Interesting reads


Sources:
1
World Federation of Exchanges, SIFMA estimates, June 2023
2 Fitch Solutions, 2022
3 https://www.ey.com/en_sg/ipo/trends, June 2023
Singapore by Eastspring Investments (Singapore) Limited (UEN: 199407631H)
Australia (for wholesale clients only) by Eastspring Investments (Singapore) Limited (UEN: 199407631H), which is incorporated in Singapore, is exempt from the requirement to hold an Australian financial services licence and is licensed and regulated by the Monetary Authority of Singapore under Singapore laws which differ from Australian laws
Hong Kong by Eastspring Investments (Hong Kong) Limited and has not been reviewed by the Securities and Futures Commission of Hong Kong.
Indonesia by PT Eastspring Investments Indonesia, an investment manager that is licensed, registered and supervised by the Indonesia Financial Services Authority (OJK).
Malaysia by Eastspring Investments Berhad (200001028634/ 531241-U) and Eastspring Al-Wara’ Investments Berhad (200901017585 / 860682-K).
Thailand by Eastspring Asset Management (Thailand) Co., Ltd.
United States of America (for institutional clients only) by Eastspring Investments (Singapore) Limited (UEN: 199407631H), which is incorporated in Singapore and is registered with the U.S Securities and Exchange Commission as a registered investment adviser.
European Economic Area (for professional clients only) and Switzerland (for qualified investors only) by Eastspring Investments (Luxembourg) S.A., 26, Boulevard Royal, 2449 Luxembourg, Grand-Duchy of Luxembourg, registered with the Registre de Commerce et des Sociétés (Luxembourg), Register No B 173737.
Chile (for institutional clients only) by Eastspring Investments (Singapore) Limited (UEN: 199407631H), which is incorporated in Singapore and is licensed and regulated by the Monetary Authority of Singapore under Singapore laws which differ from Chilean laws.
The afore-mentioned entities are hereinafter collectively referred to as Eastspring Investments.
The views and opinions contained herein are those of the author, and may not necessarily represent views expressed or reflected in other Eastspring Investments’ communications. This document is solely for information purposes and does not have any regard to the specific investment objective, financial situation and/or particular needs of any specific persons who may receive this document. This document is not intended as an offer, a solicitation of offer or a recommendation, to deal in shares of securities or any financial instruments. It may not be published, circulated, reproduced or distributed without the prior written consent of Eastspring Investments. Reliance upon information in this document is at the sole discretion of the reader. Please carefully study the related information and/or consult your own professional adviser before investing.
Investment involves risks. Past performance of and the predictions, projections, or forecasts on the economy, securities markets or the economic trends of the markets are not necessarily indicative of the future or likely performance of Eastspring Investments or any of the funds managed by Eastspring Investments.
Information herein is believed to be reliable at time of publication. Data from third party sources may have been used in the preparation of this material and Eastspring Investments has not independently verified, validated or audited such data. Where lawfully permitted, Eastspring Investments does not warrant its completeness or accuracy and is not responsible for error of facts or opinion nor shall be liable for damages arising out of any person’s reliance upon this information. Any opinion or estimate contained in this document may subject to change without notice.
Eastspring Investments companies (excluding joint venture companies) are ultimately wholly owned/indirect subsidiaries of Prudential plc of the United Kingdom. Eastspring Investments companies (including joint venture companies) and Prudential plc are not affiliated in any manner with Prudential Financial, Inc., a company whose principal place of business is in the United States of America or with the Prudential Assurance Company Limited, a subsidiary of M&G plc (a company incorporated in the United Kingdom).